Copyright
©The Author(s) 2021.
World J Cardiol. Oct 26, 2021; 13(10): 533-545
Published online Oct 26, 2021. doi: 10.4330/wjc.v13.i10.533
Published online Oct 26, 2021. doi: 10.4330/wjc.v13.i10.533
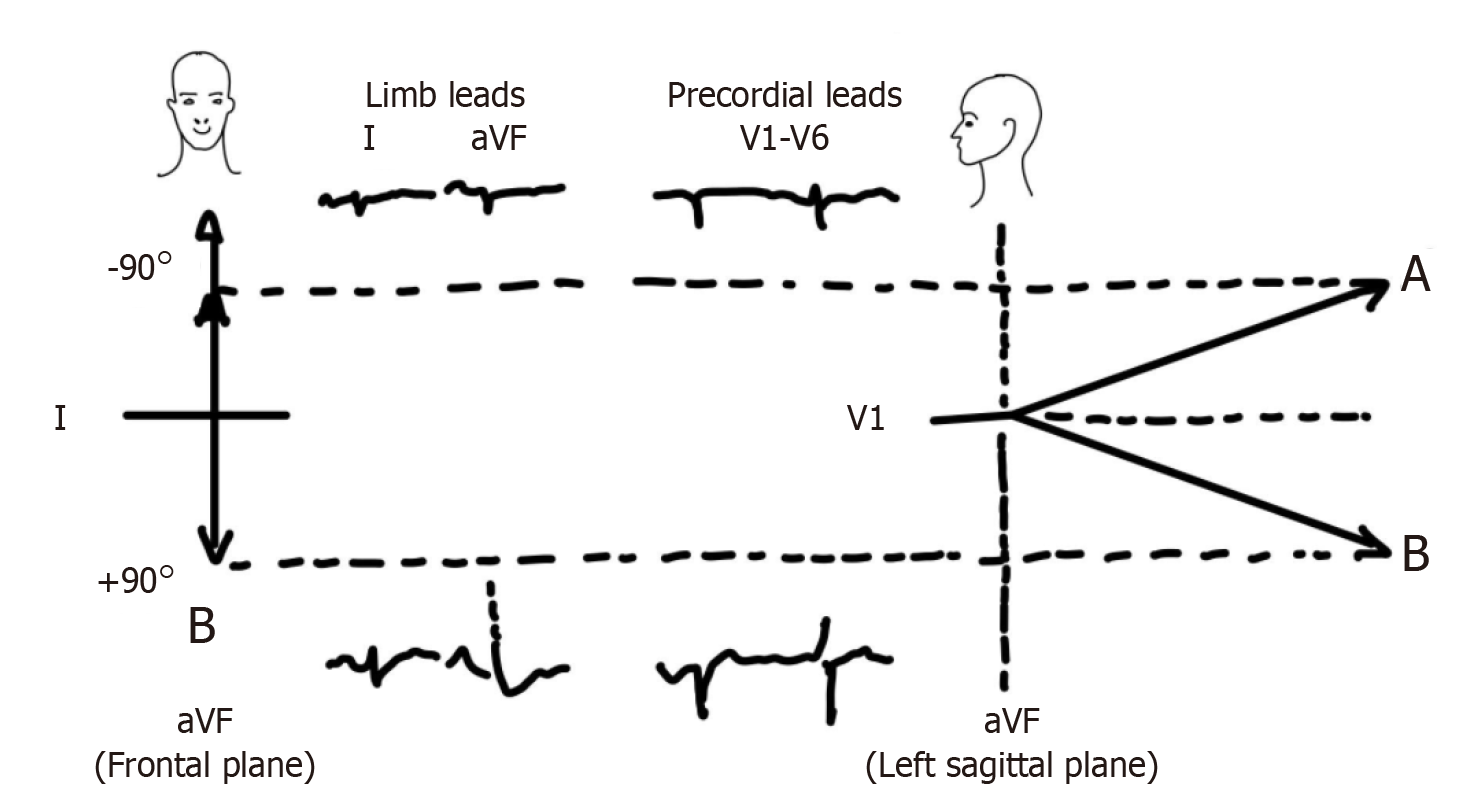
Figure 8 This is a schematic illustration of the axis-illusion phenomenon.
A and B are frontal mean QRS axes of -90° and +90° respectively, suggesting a 180° divergence. Their sagittal projections reveal that this is illusory since they are actually much closer in space. Concept adapted from David Spodick’s work.
- Citation: Gupta P, Jain H, Gill M, Bharaj G, Khalid N, Chaudhry W, Chhabra L. Electrocardiographic changes in Emphysema. World J Cardiol 2021; 13(10): 533-545
- URL: https://www.wjgnet.com/1949-8462/full/v13/i10/533.htm
- DOI: https://dx.doi.org/10.4330/wjc.v13.i10.533


