Copyright
©The Author(s) 2021.
World J Cardiol. Jan 26, 2021; 13(1): 21-27
Published online Jan 26, 2021. doi: 10.4330/wjc.v13.i1.21
Published online Jan 26, 2021. doi: 10.4330/wjc.v13.i1.21
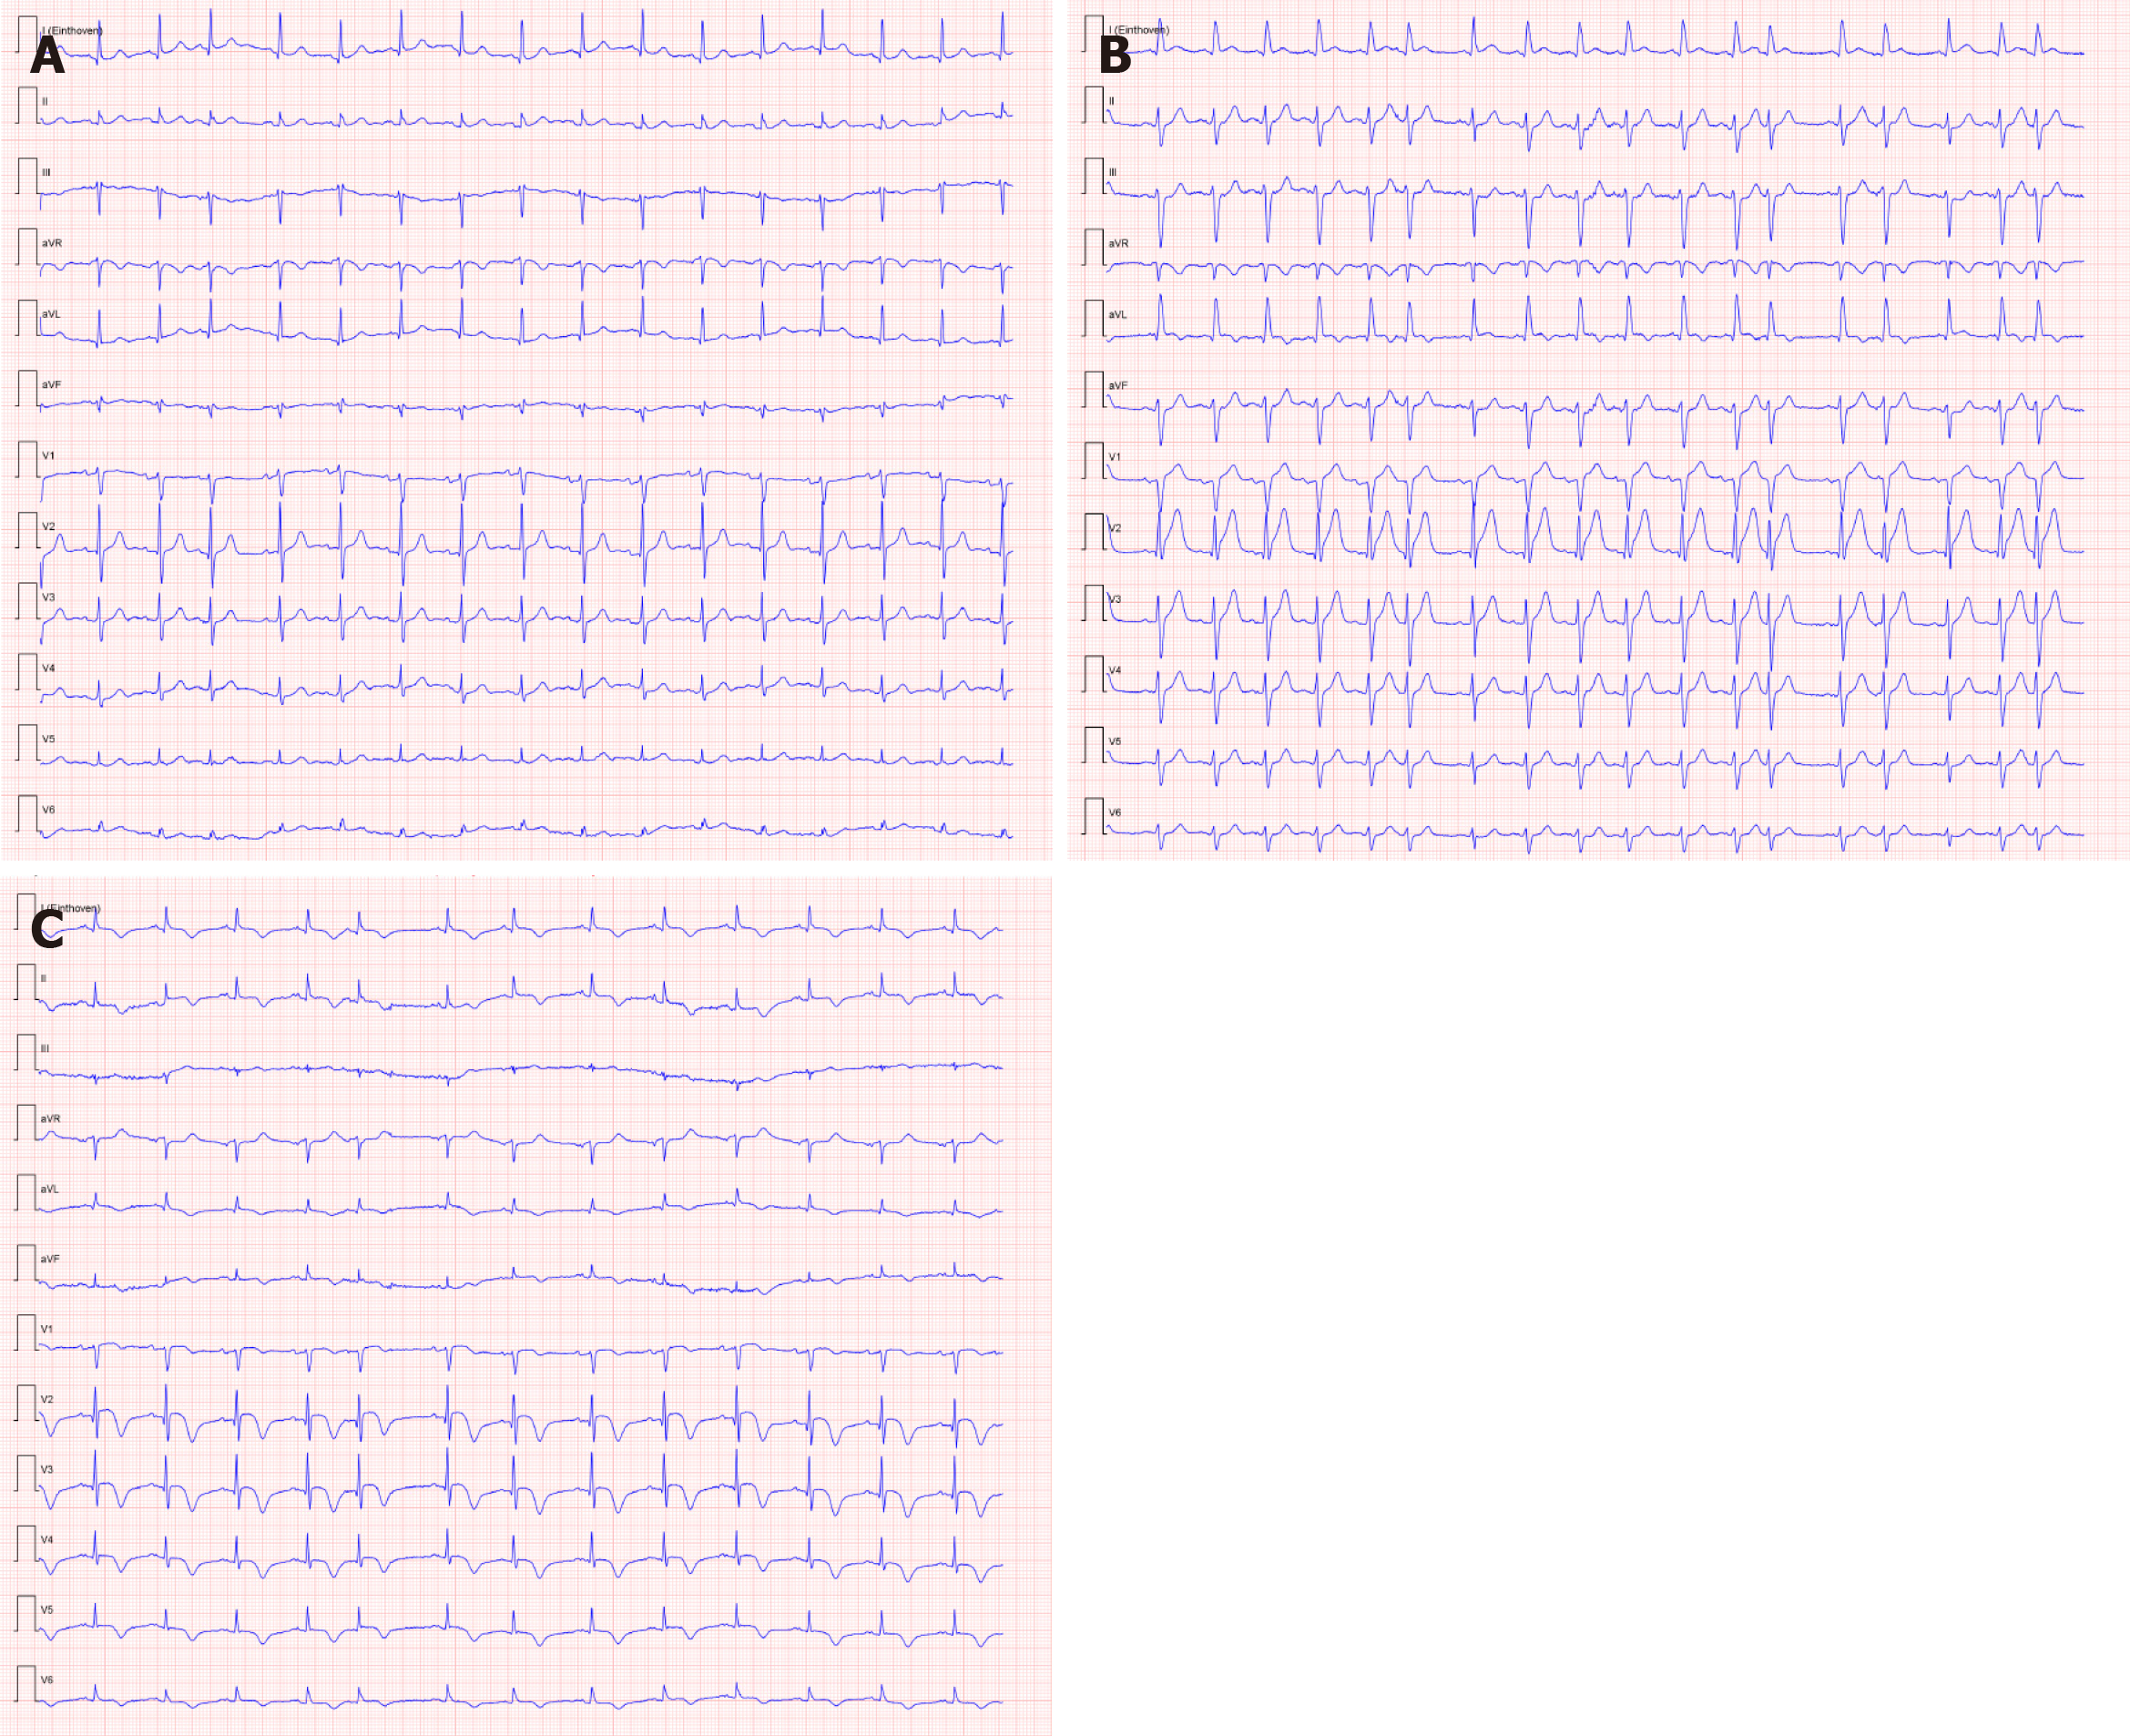
Figure 1 Comparison of electrocardiograms during the myasthenic crisis.
A: The electrocardiogram (ECG) was taken upon presentation in the emergency department and showed normal sinus rhythm, with no signs of pathology; B: The second ECG was taken at 4 h after presentation and showed ST-elevation in anterior leads (V1-V4) and lateral leads (I and aVL), with minimal reciprocal depressions in inferior leads (II and aVF) and new T-wave inversion in aVL; C: The third ECG was taken 1 d after presentation to the emergency department and showed evolving ST-elevations in anterior leads, with biphasic T-waves and new inverted T-waves in I, II, aVL and aVF.
- Citation: Kuo Y, Ottens TH, van der Bilt I, Keunen RW, Akin S. Myasthenic crisis-induced Takotsubo cardiomyopathy in an elderly man: A case report of an underestimated but deadly combination. World J Cardiol 2021; 13(1): 21-27
- URL: https://www.wjgnet.com/1949-8462/full/v13/i1/21.htm
- DOI: https://dx.doi.org/10.4330/wjc.v13.i1.21


