Copyright
©The Author(s) 2020.
World J Cardiol. Apr 26, 2020; 12(4): 123-135
Published online Apr 26, 2020. doi: 10.4330/wjc.v12.i4.123
Published online Apr 26, 2020. doi: 10.4330/wjc.v12.i4.123
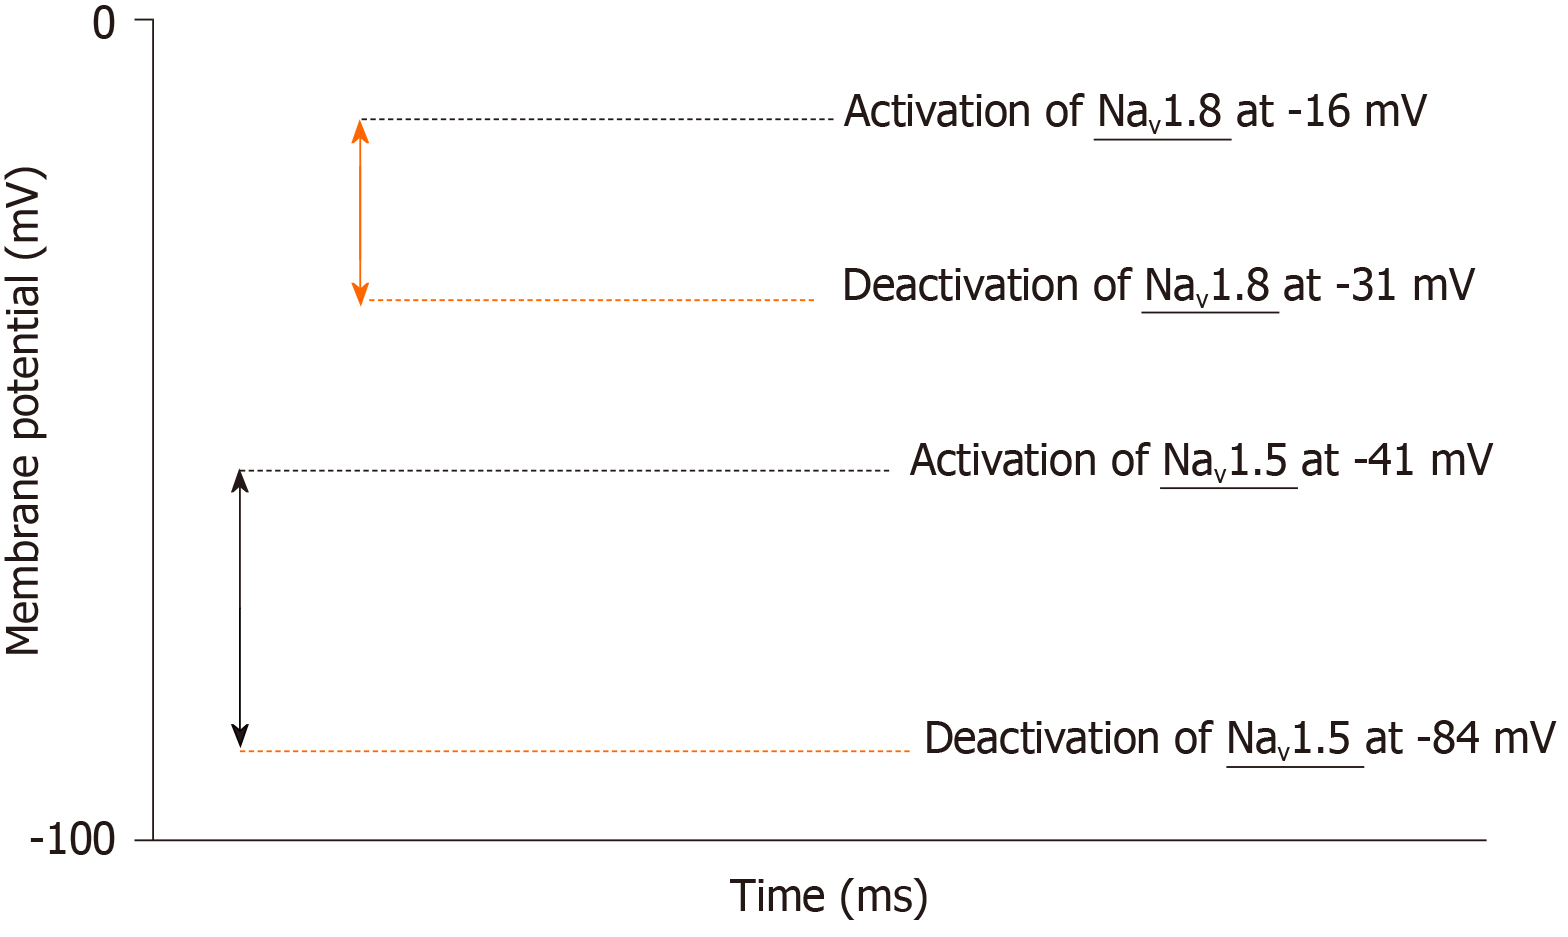
Figure 4 Visual Schematic representing the relative gating kinetics of Nav1.
5 and Nav1.8. Nav1.5 represented by the double-headed blue arrow activates at -41 mV and deactivates at -83 mV. Nav1.8 represented by the double-headed orange arrow activates at -16 mV and deactivates at -31 mV.
- Citation: Isaac E, Cooper SM, Jones SA, Loubani M. Do age-associated changes of voltage-gated sodium channel isoforms expressed in the mammalian heart predispose the elderly to atrial fibrillation? World J Cardiol 2020; 12(4): 123-135
- URL: https://www.wjgnet.com/1949-8462/full/v12/i4/123.htm
- DOI: https://dx.doi.org/10.4330/wjc.v12.i4.123


