Copyright
©The Author(s) 2019.
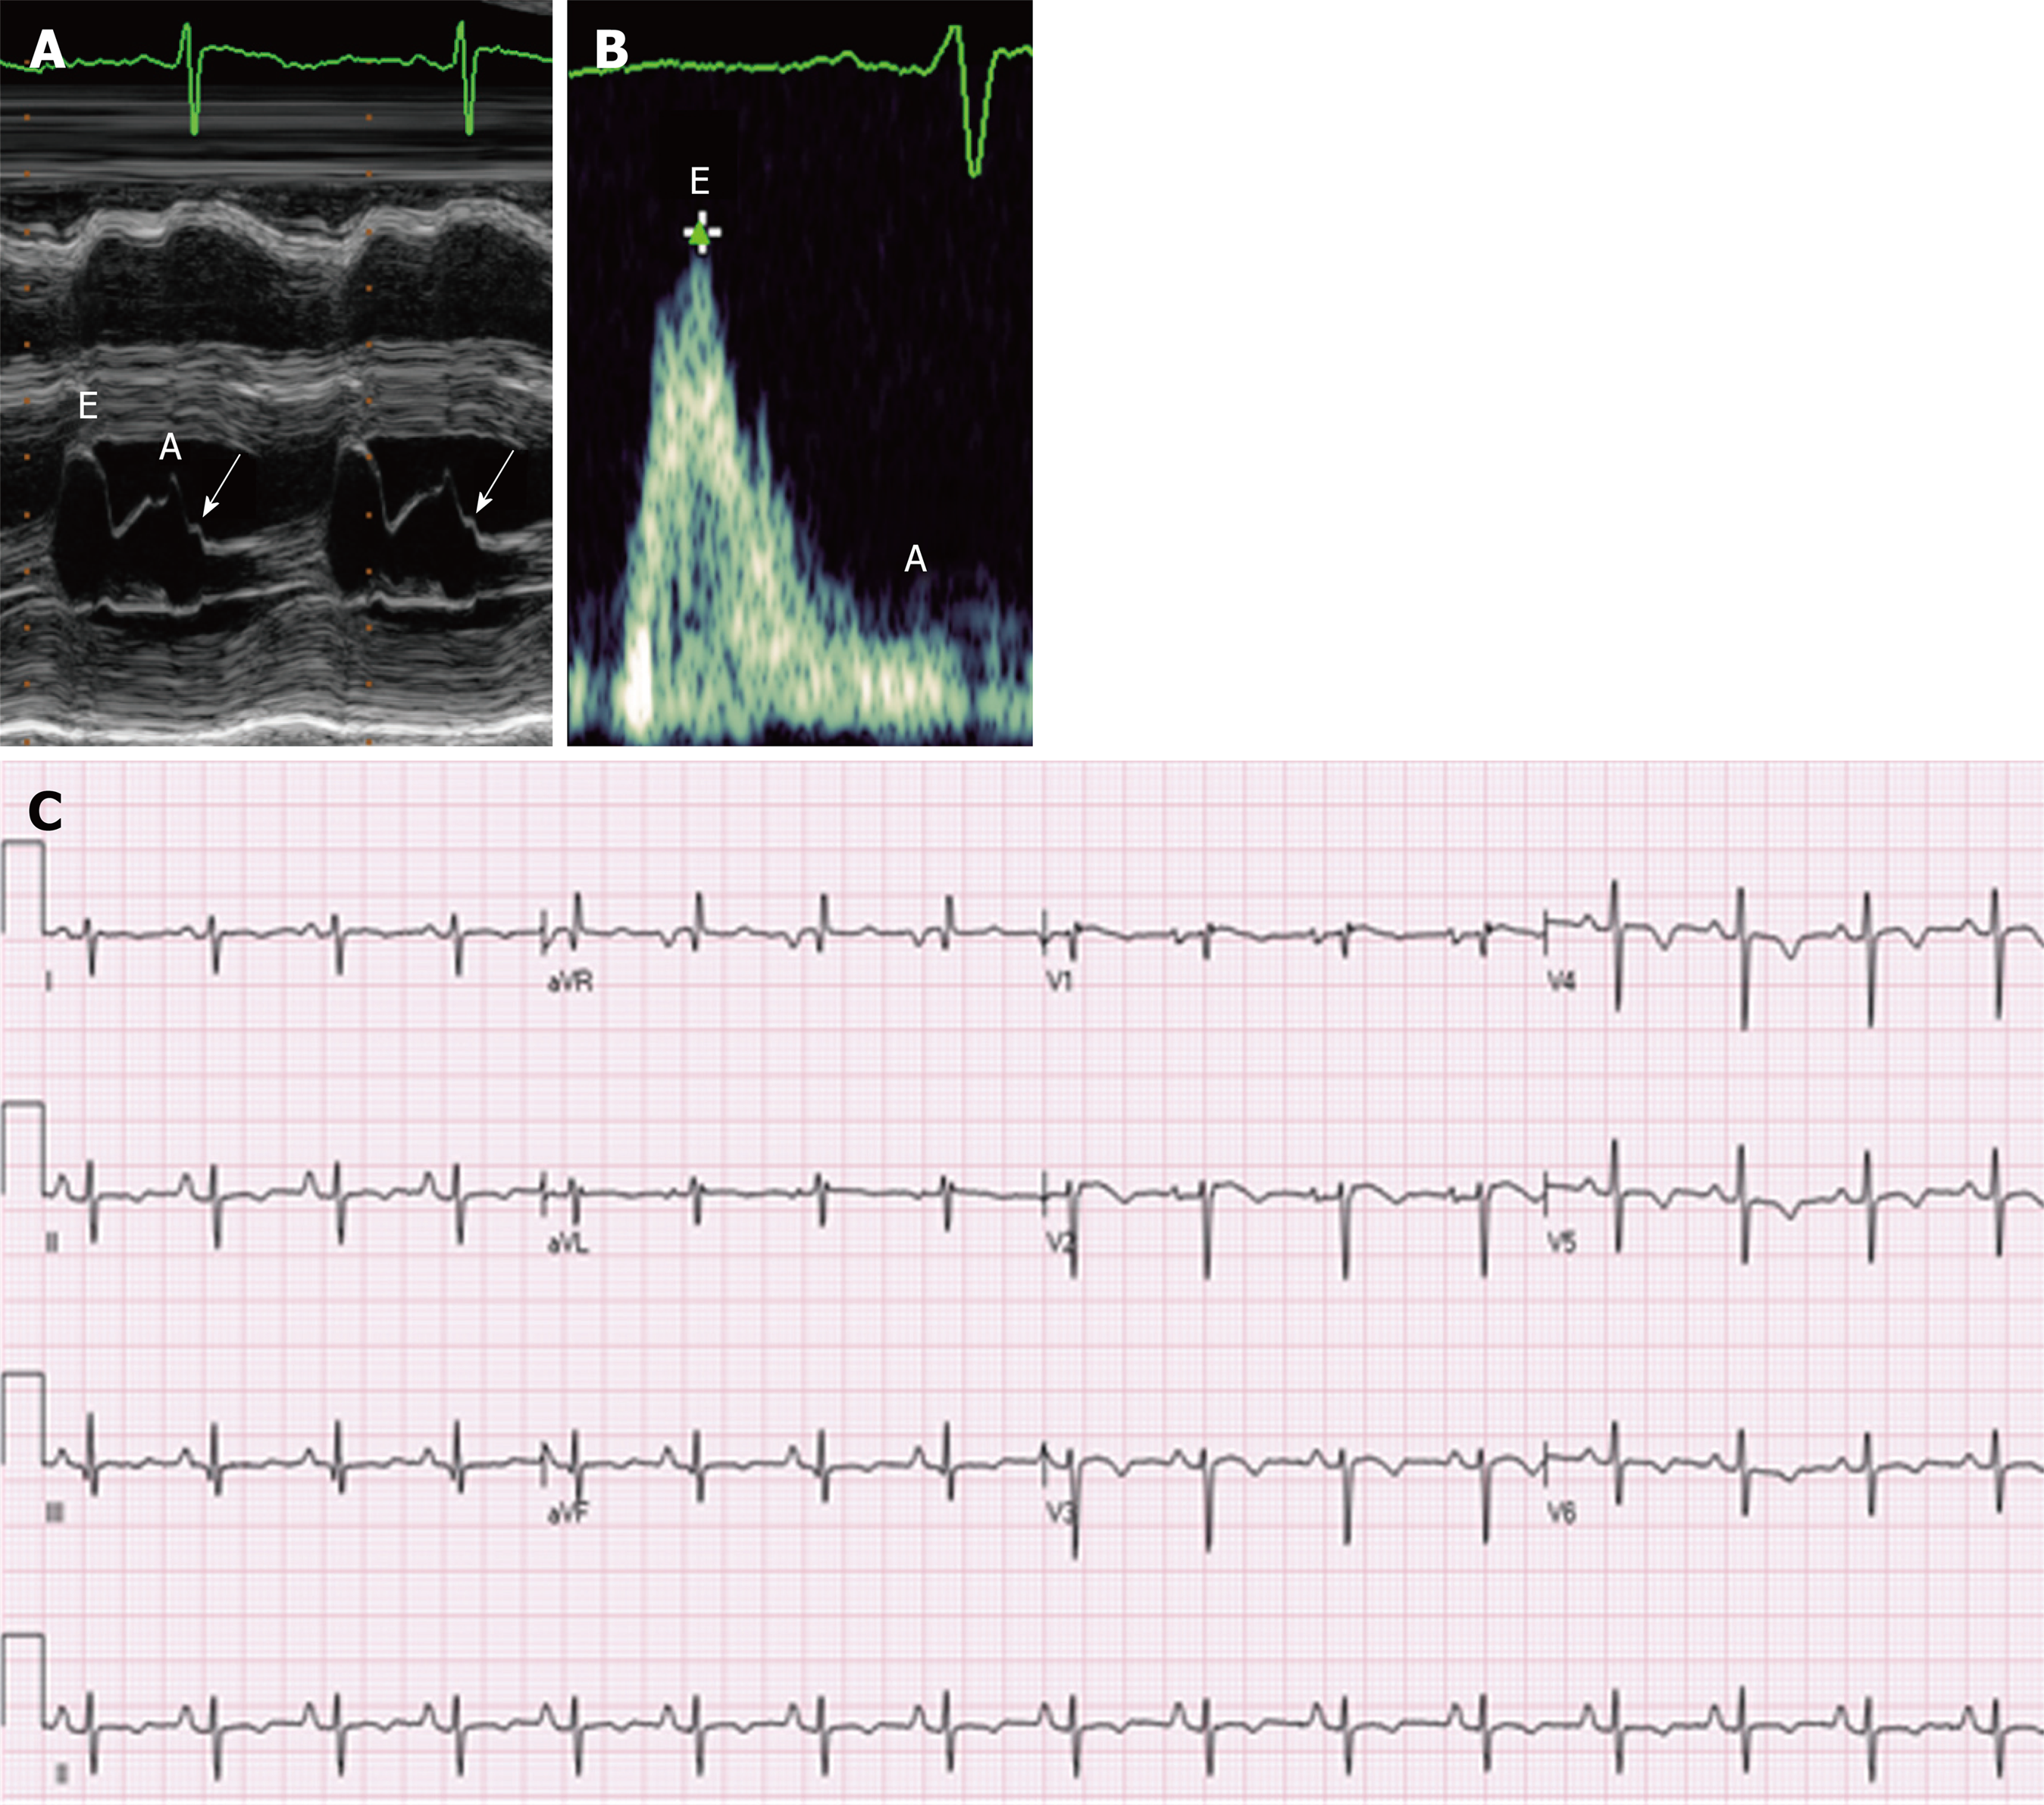
Figure 5 M-Mode image of the mitral valve, Transmitral Doppler flow showing diastolic flow and Twelve-lead electrocardiogram.
A: M-Mode image of the mitral valve in the parasternal long-axis view. Mitral valve excursion in early diastole can be seen, as can excursion due to atrial contraction in late diastole. A: “B-bump” (arrow) may be seen on the downslope of the A wave; this suggests that the end-diastolic atrial pressure is greater than the end-diastolic ventricular pressure, which is a marker of diastolic dysfunction; B: Transmitral Doppler flow showing diastolic flow. Note the large E wave in early diastole and the diminutive A wave in late diastole. The ratio of peak E wave velocity to peak A wave velocity is > 1.5, which is consistent with a “restrictive” pattern, particularly when paired with other indicators of diastolic dysfunction; C: Twelve-lead electrocardiogram demonstrating normal sinus rhythm, significant right axis deviation, poor R wave progression, and nonspecific T wave inversions in the lateral leads.
- Citation: Hanson E, Sheldon M, Pacheco B, Alkubeysi M, Raizada V. Heart disease in Friedreich’s ataxia. World J Cardiol 2019; 11(1): 1-12
- URL: https://www.wjgnet.com/1949-8462/full/v11/i1/1.htm
- DOI: https://dx.doi.org/10.4330/wjc.v11.i1.1


