Copyright
©The Author(s) 2017.
World J Biol Chem. Nov 26, 2017; 8(4): 175-186
Published online Nov 26, 2017. doi: 10.4331/wjbc.v8.i4.175
Published online Nov 26, 2017. doi: 10.4331/wjbc.v8.i4.175
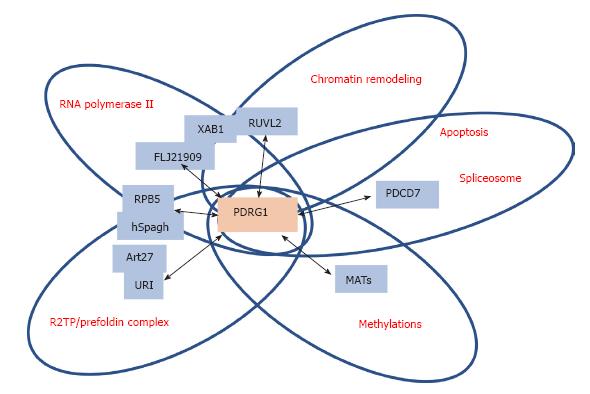
Figure 5 Schematic representation of the main PDRG1 interaction targets.
The figure highlights the main targets of interaction with PDRG1 identified using either affinity purification/mass spectrometry or yeast two-hybrid screening. The proteins involved are shown in blue boxes within circles, according to the function or multiprotein complex in which they are involved. PDRG1 appears at the intersection of these circles.
- Citation: Pajares MÁ. PDRG1 at the interface between intermediary metabolism and oncogenesis. World J Biol Chem 2017; 8(4): 175-186
- URL: https://www.wjgnet.com/1949-8454/full/v8/i4/175.htm
- DOI: https://dx.doi.org/10.4331/wjbc.v8.i4.175


