Copyright
©The Author(s) 2017.
World J Biol Chem. Nov 26, 2017; 8(4): 175-186
Published online Nov 26, 2017. doi: 10.4331/wjbc.v8.i4.175
Published online Nov 26, 2017. doi: 10.4331/wjbc.v8.i4.175
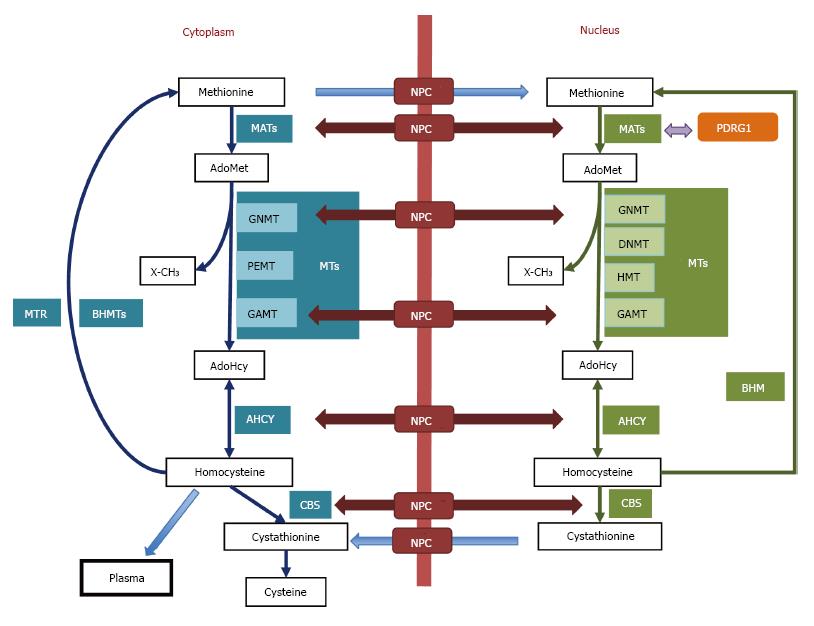
Figure 1 The cytoplasmic and nuclear branches of the hepatic methionine cycle and transsulfuration.
Essential components (metabolites and enzymes) of the pathways are shown in the figure. Cytoplasmic enzymes appear in aquamarine boxes, their nuclear equivalents are shown in green boxes, and protein interaction targets are depicted in orange. Only key methyltranferases (MTs) mentioned in the text are illustrated in both subcellular compartments. The nucleocytoplasmic transport of metabolites (blue arrows) and enzymes (maroon arrows) is shown, whereas protein interactions are indicated by violet arrows. AdoHcy: S-adenosylhomocysteine; AdoMet: S-adenosylmethionine; AHCY: S-adenosylhomocysteine hydrolase; BHMT: Betaine homocysteine S-methyltransferase; CBS: Cystathionine β-synthase; DNMT: DNA methyltransferase; GAMT: Guanidinoacetate N-methyltransferase; GNMT: Glycine N-methyltransferase; HMT: Histone methyltransferase; MATs: Methionine adenosyltransferases; MTR: Methionine synthase; NPC: Nuclear pore complex; PDRG1: p53 and DNA damage-regulated gene 1; PEMT: Phosphatidylethanolamine N-methyltransferase; X-CH3: Methylated acceptors (metabolites, proteins, DNA, etc).
- Citation: Pajares MÁ. PDRG1 at the interface between intermediary metabolism and oncogenesis. World J Biol Chem 2017; 8(4): 175-186
- URL: https://www.wjgnet.com/1949-8454/full/v8/i4/175.htm
- DOI: https://dx.doi.org/10.4331/wjbc.v8.i4.175


