Copyright
©The Author(s) 2017.
World J Biol Chem. Feb 26, 2017; 8(1): 86-94
Published online Feb 26, 2017. doi: 10.4331/wjbc.v8.i1.86
Published online Feb 26, 2017. doi: 10.4331/wjbc.v8.i1.86
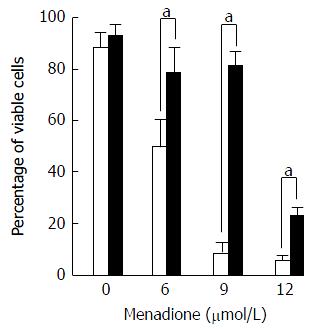
Figure 5 Protection of menadione-induced C2C12 cell death by L-carnitine.
C2C12 cells were either untreated (white histogram) or pretreated with 500 μmol/L of L-carnitine (dark histogram) and incubated for 24 h with desired concentration of menadione (from 0 to 12 μmol/L). Cell survival was evaluated by the analysis of membrane permeability to PI measured by flow cytometry. Each value represents the average percentage of viable cells remaining in the total population ± standard values. Black histograms indicate the proportion (%) of C2C12 that was not PI positive. White histograms indicate the proportion (%) of C2C12 pretreated with L-carnitine that was not PI positive. A star on top of two histograms indicates a significant difference between untreated and L-carnitine treated cells (P < 0.05).
- Citation: Le Borgne F, Ravaut G, Bernard A, Demarquoy J. L-carnitine protects C2C12 cells against mitochondrial superoxide overproduction and cell death. World J Biol Chem 2017; 8(1): 86-94
- URL: https://www.wjgnet.com/1949-8454/full/v8/i1/86.htm
- DOI: https://dx.doi.org/10.4331/wjbc.v8.i1.86


