Copyright
©The Author(s) 2017.
World J Biol Chem. Feb 26, 2017; 8(1): 86-94
Published online Feb 26, 2017. doi: 10.4331/wjbc.v8.i1.86
Published online Feb 26, 2017. doi: 10.4331/wjbc.v8.i1.86
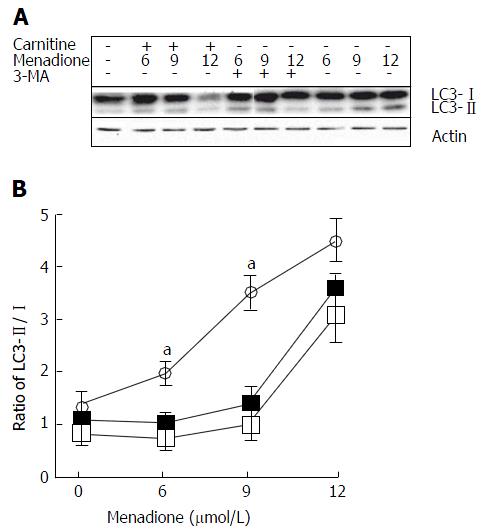
Figure 4 Menadione induces autophagy in C2C12 cells.
A: Western blot for the determination of LC3 I and II forms. Initial cells were either treated with L-carnitine, menadione or 3-MA; B: LC3-I and II isoforms were detected by western blotting and quantified. The ratio between I and II forms was calculated and plotted in this figure. The black squares represent L-carnitine treated cells whereas empty circles represent C2C12 cells that were not pretreated with L-carnitine. Empty squares represent cells treated with 5 mmol/L of 3-MA. Each point is the mean of 4 independent experiments (± standard values). For each concentration of menadione, a star indicates a significant difference between untreated and L-carnitine treated cells (P < 0.05).
- Citation: Le Borgne F, Ravaut G, Bernard A, Demarquoy J. L-carnitine protects C2C12 cells against mitochondrial superoxide overproduction and cell death. World J Biol Chem 2017; 8(1): 86-94
- URL: https://www.wjgnet.com/1949-8454/full/v8/i1/86.htm
- DOI: https://dx.doi.org/10.4331/wjbc.v8.i1.86


