Copyright
©The Author(s) 2015.
World J Biol Chem. Aug 26, 2015; 6(3): 249-264
Published online Aug 26, 2015. doi: 10.4331/wjbc.v6.i3.249
Published online Aug 26, 2015. doi: 10.4331/wjbc.v6.i3.249
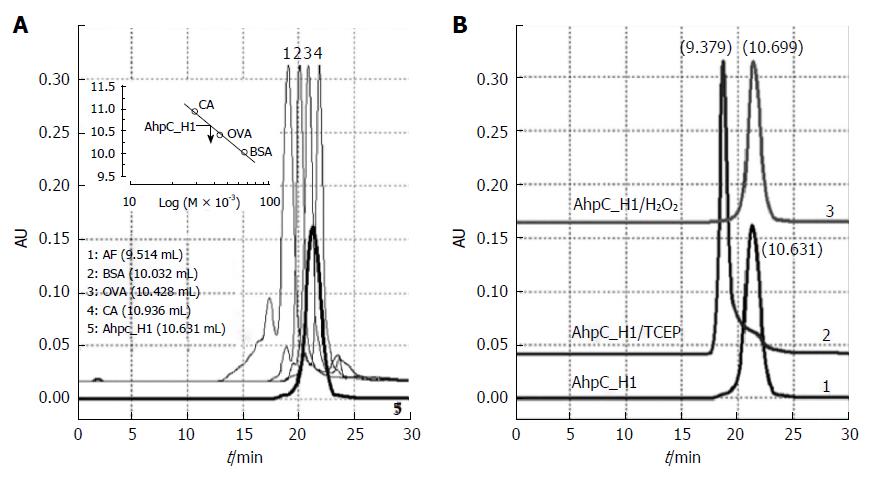
Figure 6 High-performance liquid chromatography gel-filtration chromatograms of AhpC_H1 purified from B.
subtilis. AhpC_H1 was loaded onto a ZORBAX® Pro 10/300 GF450 column and eluted with 50 mmol/L phosphate buffer, pH 7.4, containing 150 mmol/L KCl. A: AhpC_H1 elution profile (bold line, 5); protein molecular mass standards: 1, apoferritin (AF, 443 kDa); 2, bovine serum albumin (BSA, 66 kDa); 3, ovalbumin (OVA, 44 kDa); 4, carbonic anhydrase (CA, 29 kDa). Inset shows a calibration curve used to determine AhpC_H1 molecular mass; B: The profiles of TCEP-reduced AhpC_H1 (AhpC_H1/TCEP) and AhpC_H1 treated with 2 mmol/L H2O2 for 30 min at 30 °C (AhpC_H1/H2O2) were compared with that of untreated AhpC_H1. Elution volume (mL) is in parentheses. Oligomeric AhpC_H1 was eluted at 9.379 mL.
-
Citation: Cha MK, Bae YJ, Kim KJ, Park BJ, Kim IH. Characterization of two alkyl hydroperoxide reductase C homologs alkyl hydroperoxide reductase C_H1 and alkyl hydroperoxide reductase C_H2 in
Bacillus subtilis . World J Biol Chem 2015; 6(3): 249-264 - URL: https://www.wjgnet.com/1949-8454/full/v6/i3/249.htm
- DOI: https://dx.doi.org/10.4331/wjbc.v6.i3.249


