Copyright
©2014 Baishideng Publishing Group Inc.
World J Biol Chem. Nov 26, 2014; 5(4): 437-456
Published online Nov 26, 2014. doi: 10.4331/wjbc.v5.i4.437
Published online Nov 26, 2014. doi: 10.4331/wjbc.v5.i4.437
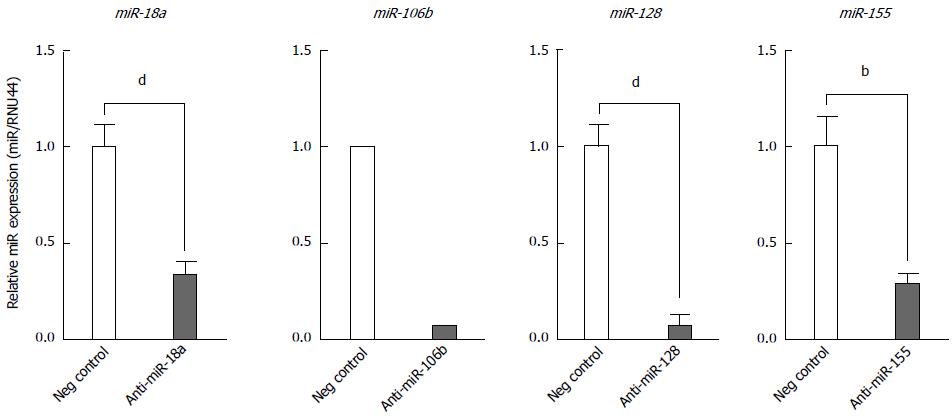
Figure 7 Effect of anti-miR transfection on microRNA expression in BEAS-2B cells.
MicroRNA expression was quantified by reverse transcription-quantitative polymerase chain reaction (RT-qPCR) 24 h post-transfection with either a negative control anti-miR or the indicated specific anti-miR. Plotted values for miR-18a, -128 and -155 represent the mean ± SD of three independent experiments. Unpaired t test was used to calculate P values for cells transfected with the specific anti-miR vs negative control anti-miR. bP < 0.01; dP < 0.01. The values plotted for miR-106b represent the average of qPCR duplicates from one experiment.
- Citation: Bondanese VP, Francisco-Garcia A, Bedke N, Davies DE, Sanchez-Elsner T. Identification of host miRNAs that may limit human rhinovirus replication. World J Biol Chem 2014; 5(4): 437-456
- URL: https://www.wjgnet.com/1949-8454/full/v5/i4/437.htm
- DOI: https://dx.doi.org/10.4331/wjbc.v5.i4.437


