Copyright
©2014 Baishideng Publishing Group Inc.
World J Biol Chem. May 26, 2014; 5(2): 240-253
Published online May 26, 2014. doi: 10.4331/wjbc.v5.i2.240
Published online May 26, 2014. doi: 10.4331/wjbc.v5.i2.240
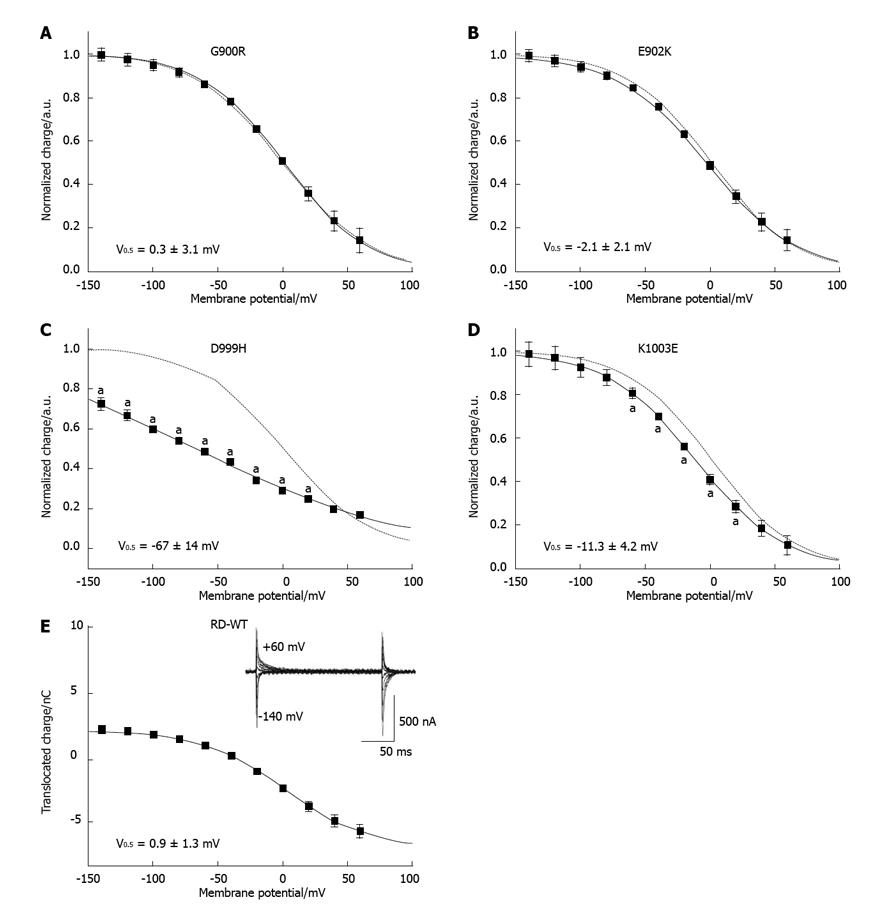
Figure 4 Voltage dependence of translocated transient charge.
A-E: Normalized Q(V) curves from ouabain-sensitive transient currents for the RD-WT enzyme (E), and for the mutants G900R (A), E902K (B), D999H (C) and K1003E (D). Fits of a Boltzmann function to the data are superimposed. Qmin and Qmax determined by the fit were used for normalization. The Boltzmann curve of the RD-WT enzyme is shown as a dotted line for comparison. Transient current signals are shown in a box for the RD-WT enzyme in panel (E). An “a” indicates that the data point was significantly different from the RD-WT data (aP < 0.05 vs RD-WT, Student’s t-test).
- Citation: Spiller S, Friedrich T. Functional analysis of human Na+/K+-ATPase familial or sporadic hemiplegic migraine mutations expressed in Xenopus oocytes. World J Biol Chem 2014; 5(2): 240-253
- URL: https://www.wjgnet.com/1949-8454/full/v5/i2/240.htm
- DOI: https://dx.doi.org/10.4331/wjbc.v5.i2.240


