Copyright
©2013 Baishideng Publishing Group Co.
World J Biol Chem. Nov 26, 2013; 4(4): 119-130
Published online Nov 26, 2013. doi: 10.4331/wjbc.v4.i4.119
Published online Nov 26, 2013. doi: 10.4331/wjbc.v4.i4.119
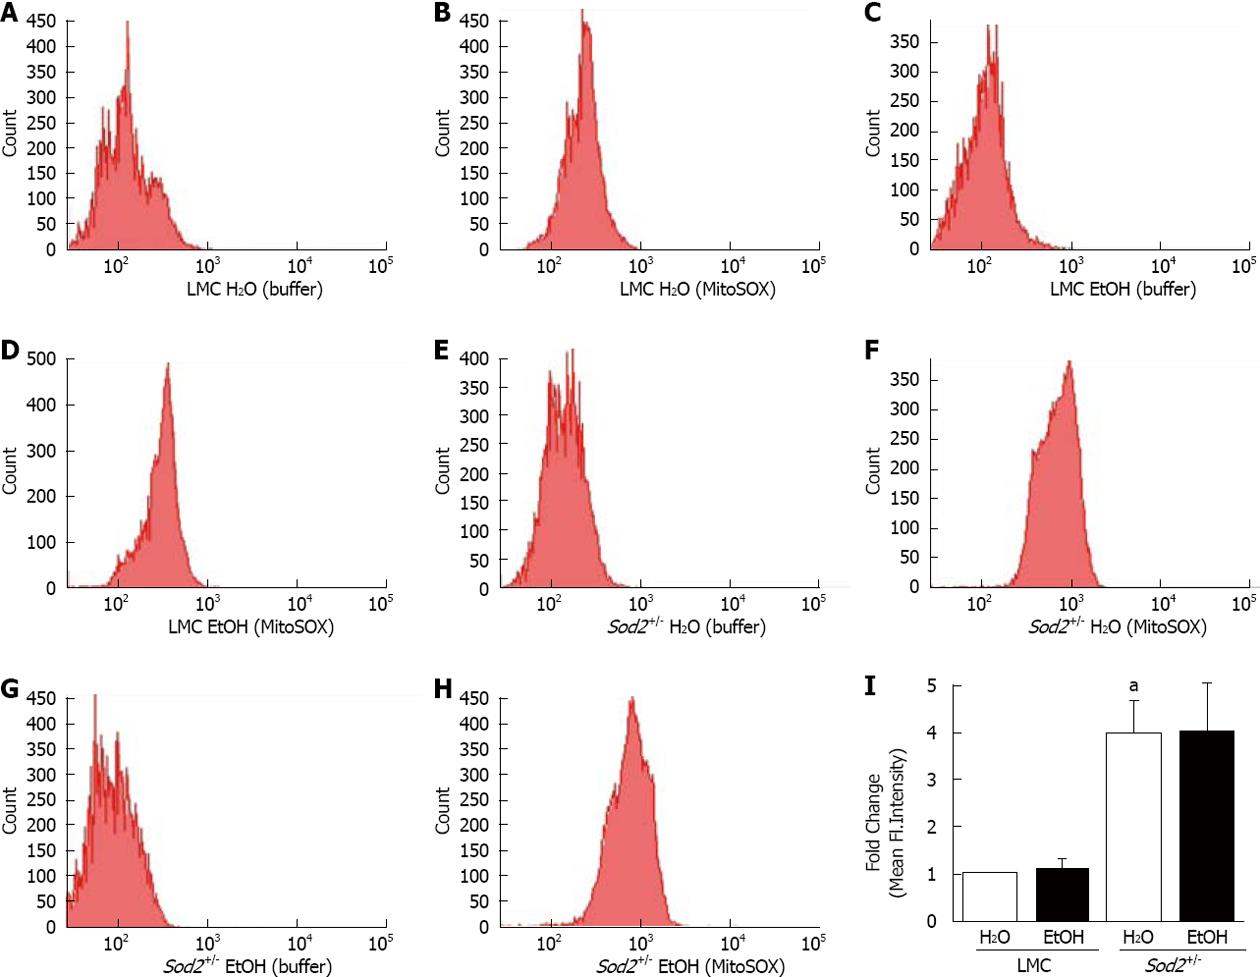
Figure 5 Alcohol and mitochondrial superoxide production.
Hepatocytes, isolated from the livers of LMC (A-D) and Sod2+/- (E-H) mice fed with plain water (H2O; A, B, E, F) or 10% ethanol (EtOH; C, D, G, H), were incubated with buffer, as control (A, C, E, G) or MitoSOX Red (B, D, F, H) and analyzed by flow cytometry, as described in Methods. A-H: Representative histograms; I: Quantitative analysis showing fold changes in mean fluorescent intensity in hepatocytes of water-fed Sod2+/-, and alcohol-treated LMC and Sod2+/- compared to that of littermate control (LMC) mice fed with plain water. Samples incubated with MitoSOX Red were normalized for background fluorescence by subtracting the values of control (buffer only) incubations. The letter a indicates statistical significance (aP < 0.05).
- Citation: Harrison-Findik DD, Lu S, Zmijewski EM, Jones J, Zimmerman MC. Effect of alcohol exposure on hepatic superoxide generation and hepcidin expression. World J Biol Chem 2013; 4(4): 119-130
- URL: https://www.wjgnet.com/1949-8454/full/v4/i4/119.htm
- DOI: https://dx.doi.org/10.4331/wjbc.v4.i4.119


