Copyright
©2012 Baishideng Publishing Group Co.
World J Biol Chem. Jul 26, 2012; 3(7): 159-166
Published online Jul 26, 2012. doi: 10.4331/wjbc.v3.i7.159
Published online Jul 26, 2012. doi: 10.4331/wjbc.v3.i7.159
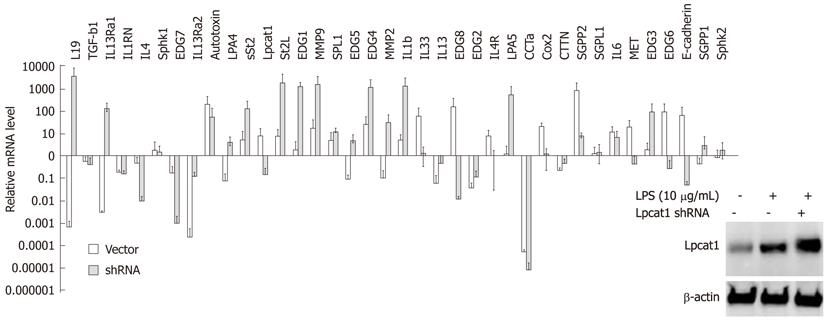
Figure 3 Lipopolysaccharide inducible gene expression profiles after Lpcat1 knockdown.
Protein levels were determined with Lpcat1 immunoblotting in wild type, LPS treated wild type, and LPS treated Lpcat1 knockdown MLE cells as showed in the imbedded image. Total cellular RNA was extracted from cells and quantitative reverse transcription-polymerase chain reaction analysis was performed. The relative mRNA levels of the genes in LPS treated samples were normalized by the same gene from untreated MLE cells. The data represents the mean value (mean + SEM) from three independent experiments. LPS: Lipopolysaccharide.
- Citation: Ellis B, Kaercher L, Snavely C, Zhao Y, Zou C. Lipopolysaccharide triggers nuclear import of Lpcat1 to regulate inducible gene expression in lung epithelia. World J Biol Chem 2012; 3(7): 159-166
- URL: https://www.wjgnet.com/1949-8454/full/v3/i7/159.htm
- DOI: https://dx.doi.org/10.4331/wjbc.v3.i7.159


