Copyright
©2011 Baishideng Publishing Group Co.
World J Biol Chem. Jan 26, 2011; 2(1): 14-24
Published online Jan 26, 2011. doi: 10.4331/wjbc.v2.i1.14
Published online Jan 26, 2011. doi: 10.4331/wjbc.v2.i1.14
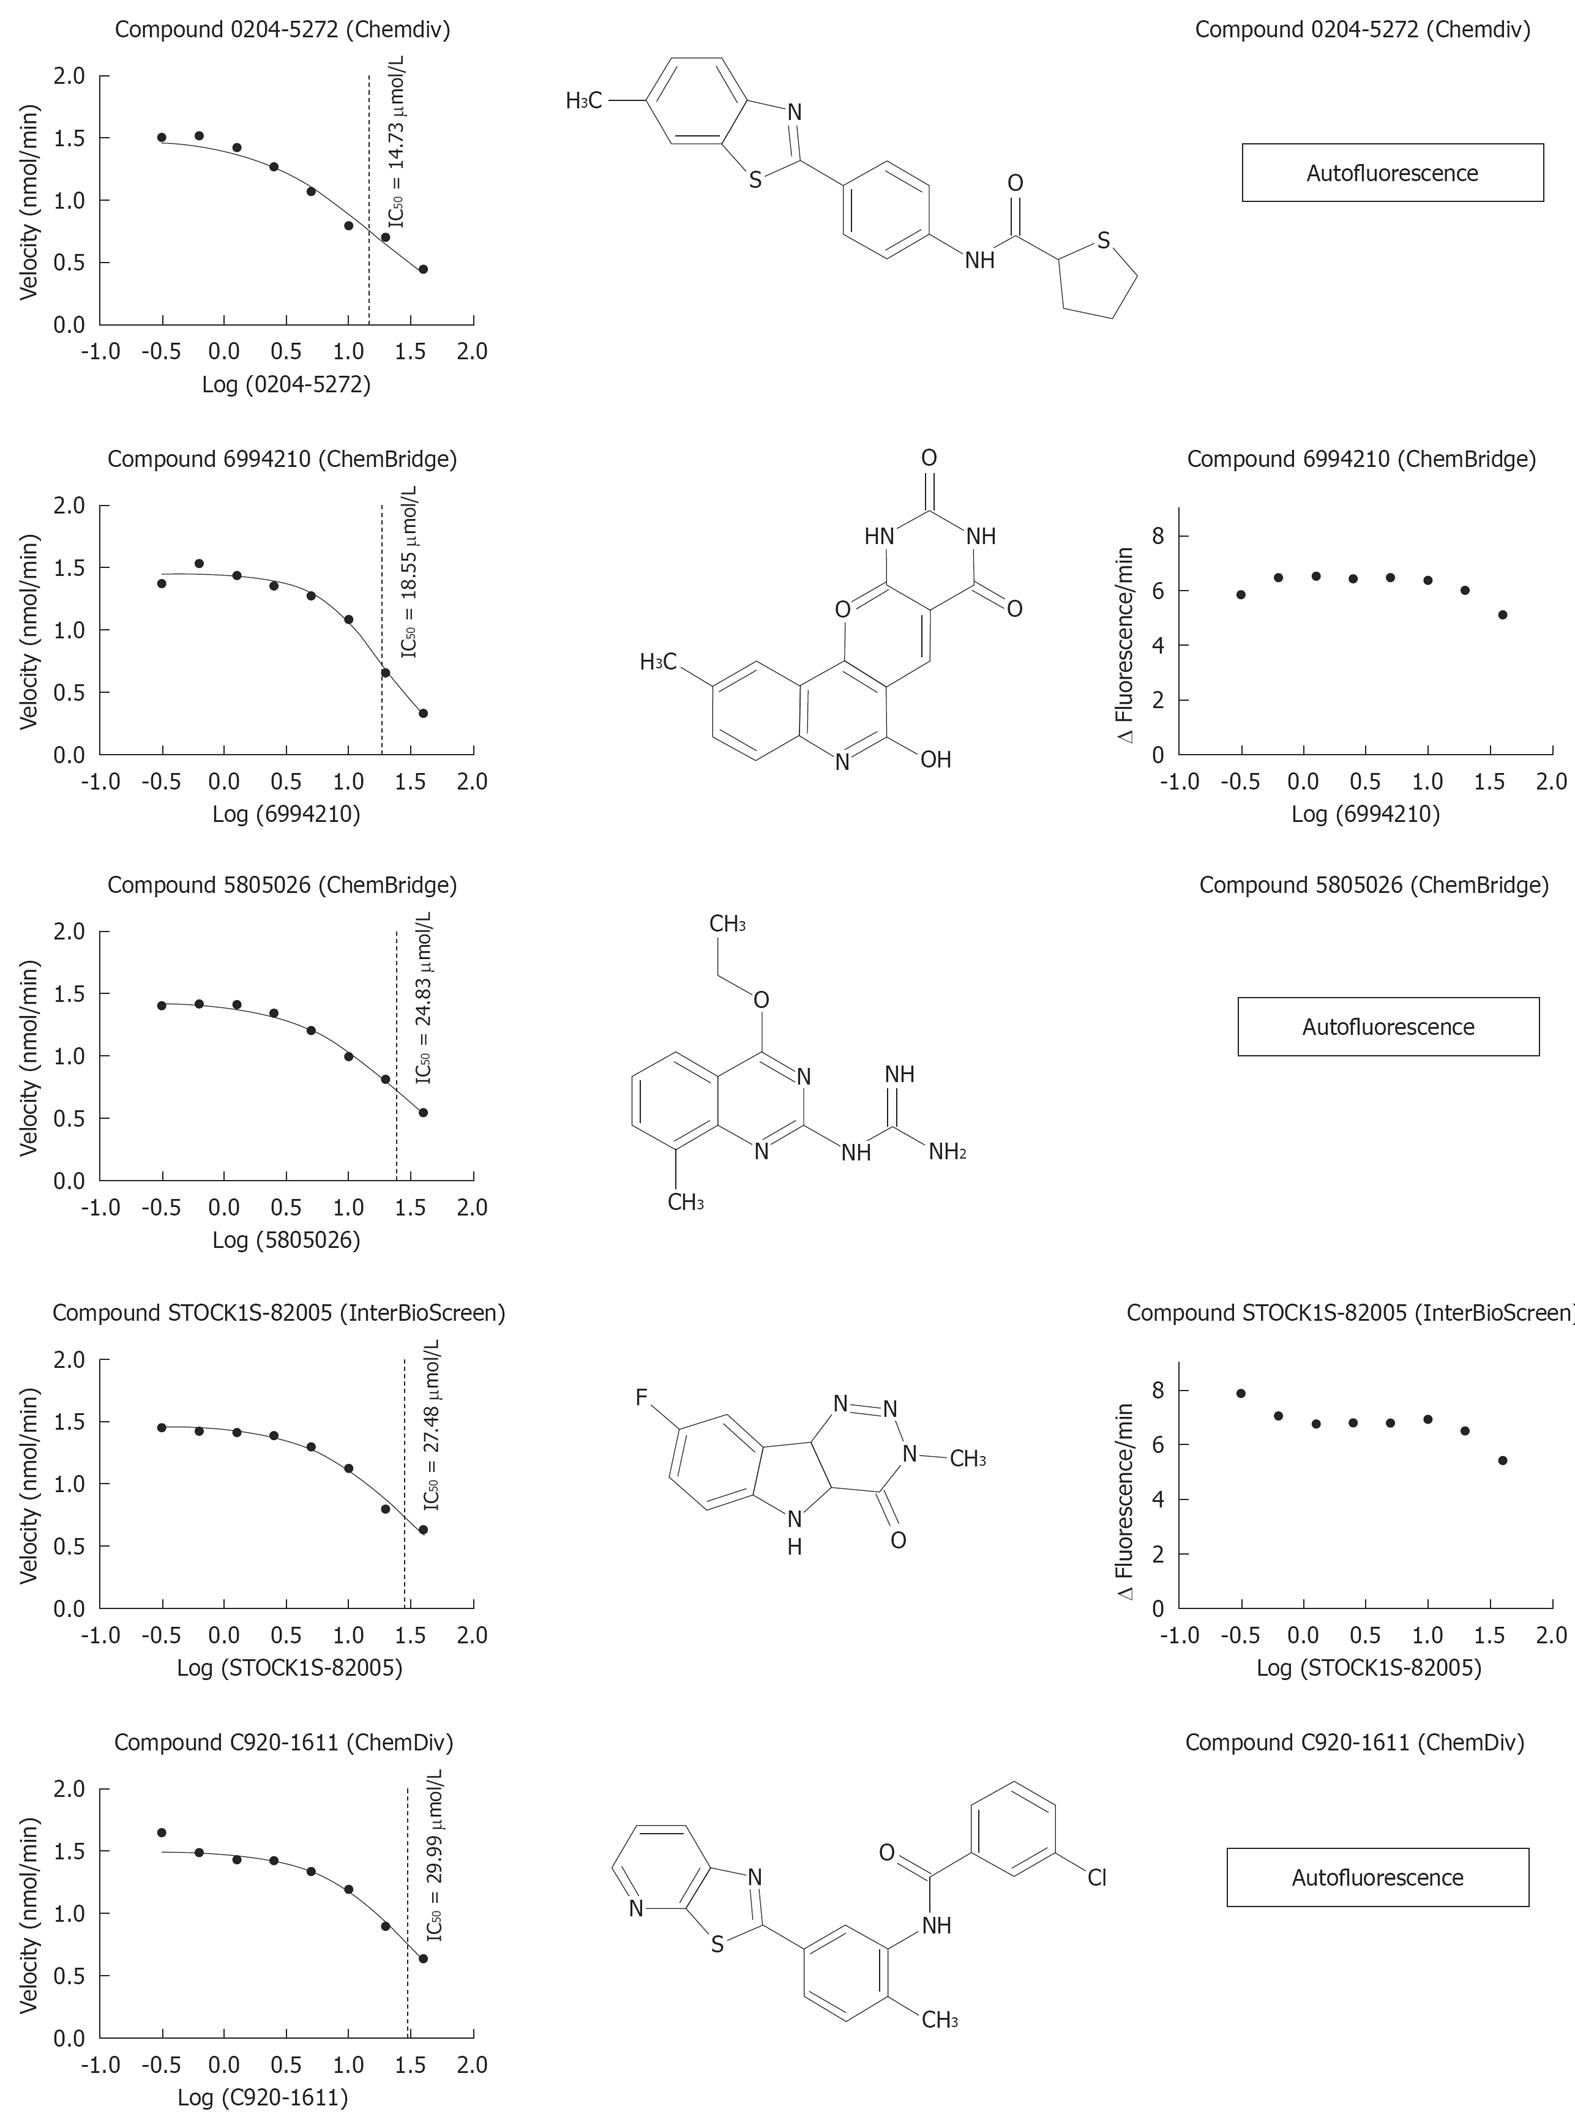
Figure 7 Dose-response graph, IC50 and molecular structure of the 5 most active compounds (IC50 < 40 μmol/L) on conversion of DQ™-gelatin and a fluorescent peptide by matrix metalloproteinase-9.
The results obtained with the DQ™-gelatin assay (including the IC50s) are shown in the left column. The chemical structures are shown in the central column. Data with the fluorescent peptide are shown in the right column.
- Citation: Vandooren J, Geurts N, Martens E, Steen PEVD, Jonghe SD, Herdewijn P, Opdenakker G. Gelatin degradation assay reveals MMP-9 inhibitors and function of O-glycosylated domain. World J Biol Chem 2011; 2(1): 14-24
- URL: https://www.wjgnet.com/1949-8454/full/v2/i1/14.htm
- DOI: https://dx.doi.org/10.4331/wjbc.v2.i1.14


