Copyright
©2011 Baishideng Publishing Group Co.
World J Biol Chem. Jan 26, 2011; 2(1): 14-24
Published online Jan 26, 2011. doi: 10.4331/wjbc.v2.i1.14
Published online Jan 26, 2011. doi: 10.4331/wjbc.v2.i1.14
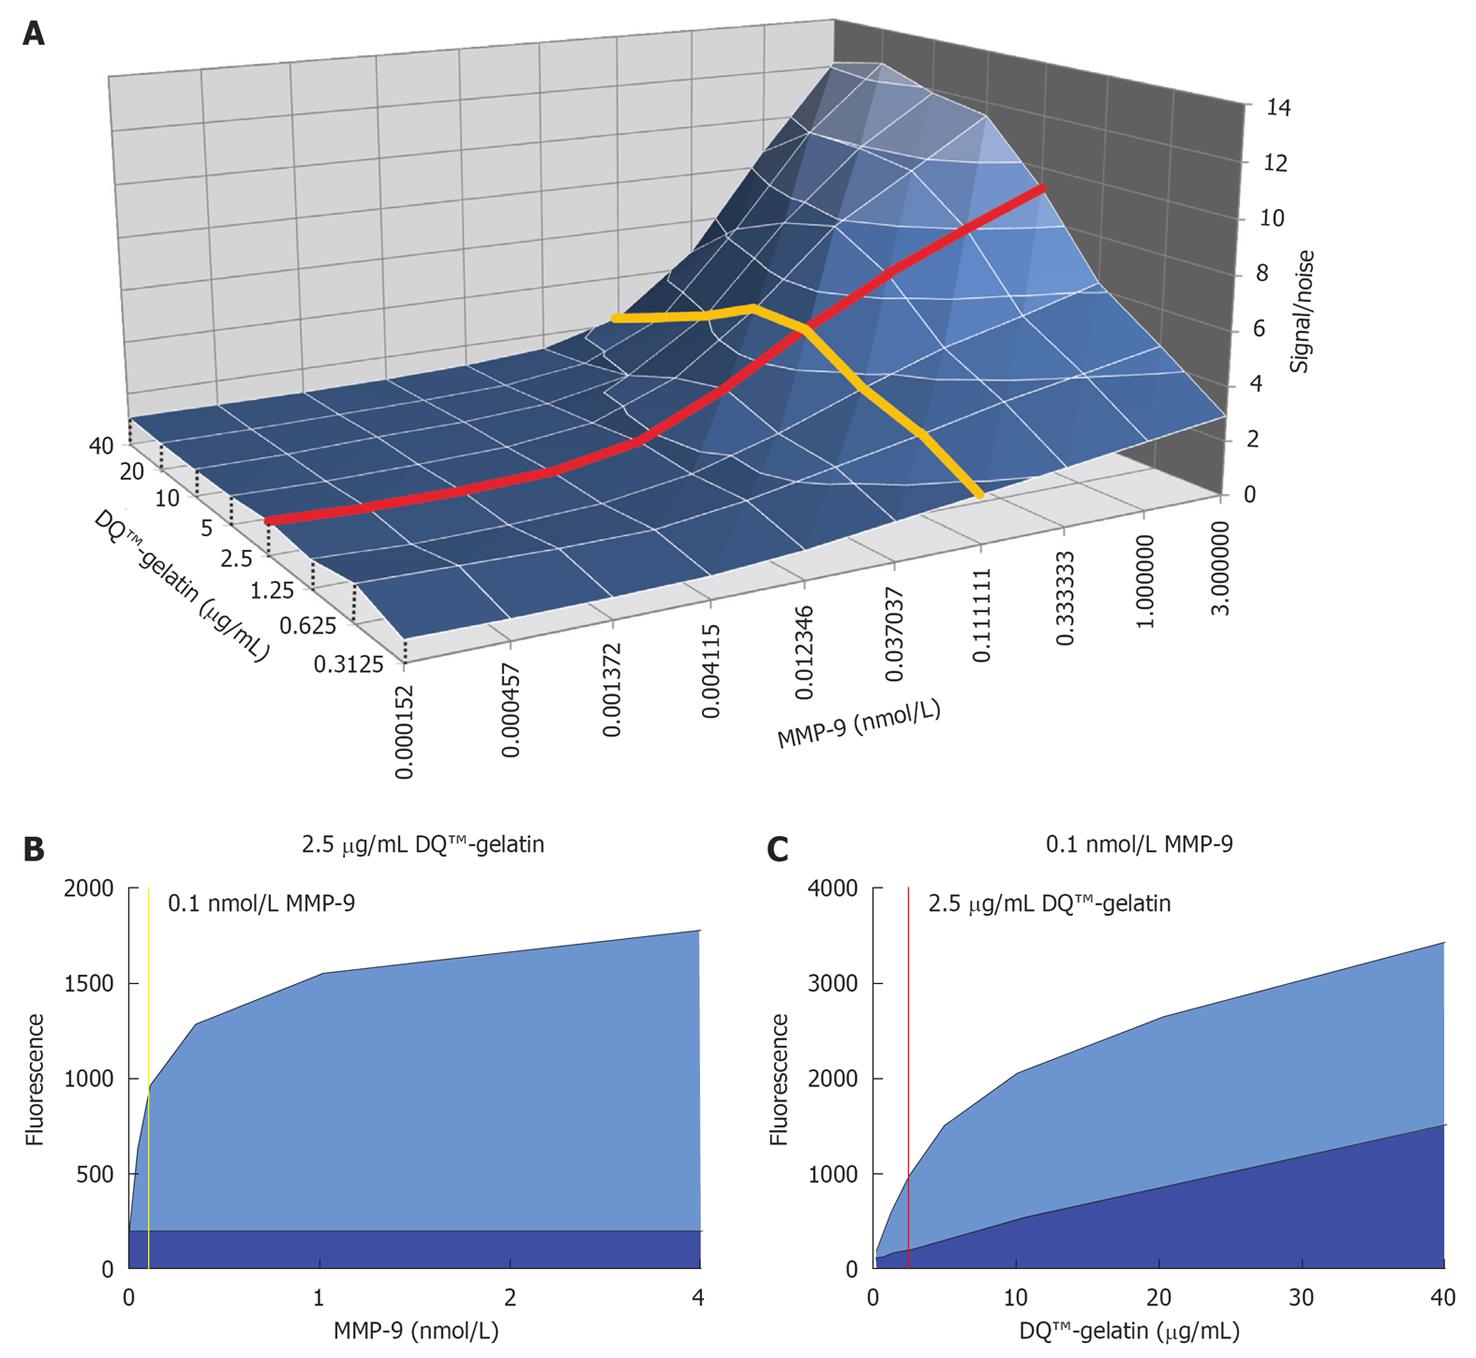
Figure 1 Optimization of enzyme and substrate concentrations.
A: 3D surface representation of the signal fluorescence divided by the noise fluorescence (signal/noise) as a function of the enzyme [matrix metalloproteinase (MMP)-9 FL] and substrate (DQ™-gelatin) concentration. Data were obtained after an incubation period of 2 h. The red line represents the signal-to-noise ratio as a function of variable enzyme concentration and at a constant substrate concentration of 2.5 μg/mL. The yellow line shows the signal-to-noise ratio at variable substrate concentrations and at a constant enzyme concentration of approximately 0.1 nmol/L. These enzyme and substrate concentrations were chosen for further testing; B: The fluorescence signal (light blue surface) and noise fluorescence (dark blue surface) under different enzyme concentrations and at a constant substrate concentration of 2.5 μg/mL is shown; C: The fluorescence signal (light blue surface) and noise fluorescence (dark blue surface) under different substrate concentrations and at a constant concentration of 0.1 nmol/L MMP-9 FL is plotted.
- Citation: Vandooren J, Geurts N, Martens E, Steen PEVD, Jonghe SD, Herdewijn P, Opdenakker G. Gelatin degradation assay reveals MMP-9 inhibitors and function of O-glycosylated domain. World J Biol Chem 2011; 2(1): 14-24
- URL: https://www.wjgnet.com/1949-8454/full/v2/i1/14.htm
- DOI: https://dx.doi.org/10.4331/wjbc.v2.i1.14


