Copyright
©The Author(s) 2022.
World J Biol Chem. Jan 27, 2022; 13(1): 15-34
Published online Jan 27, 2022. doi: 10.4331/wjbc.v13.i1.15
Published online Jan 27, 2022. doi: 10.4331/wjbc.v13.i1.15
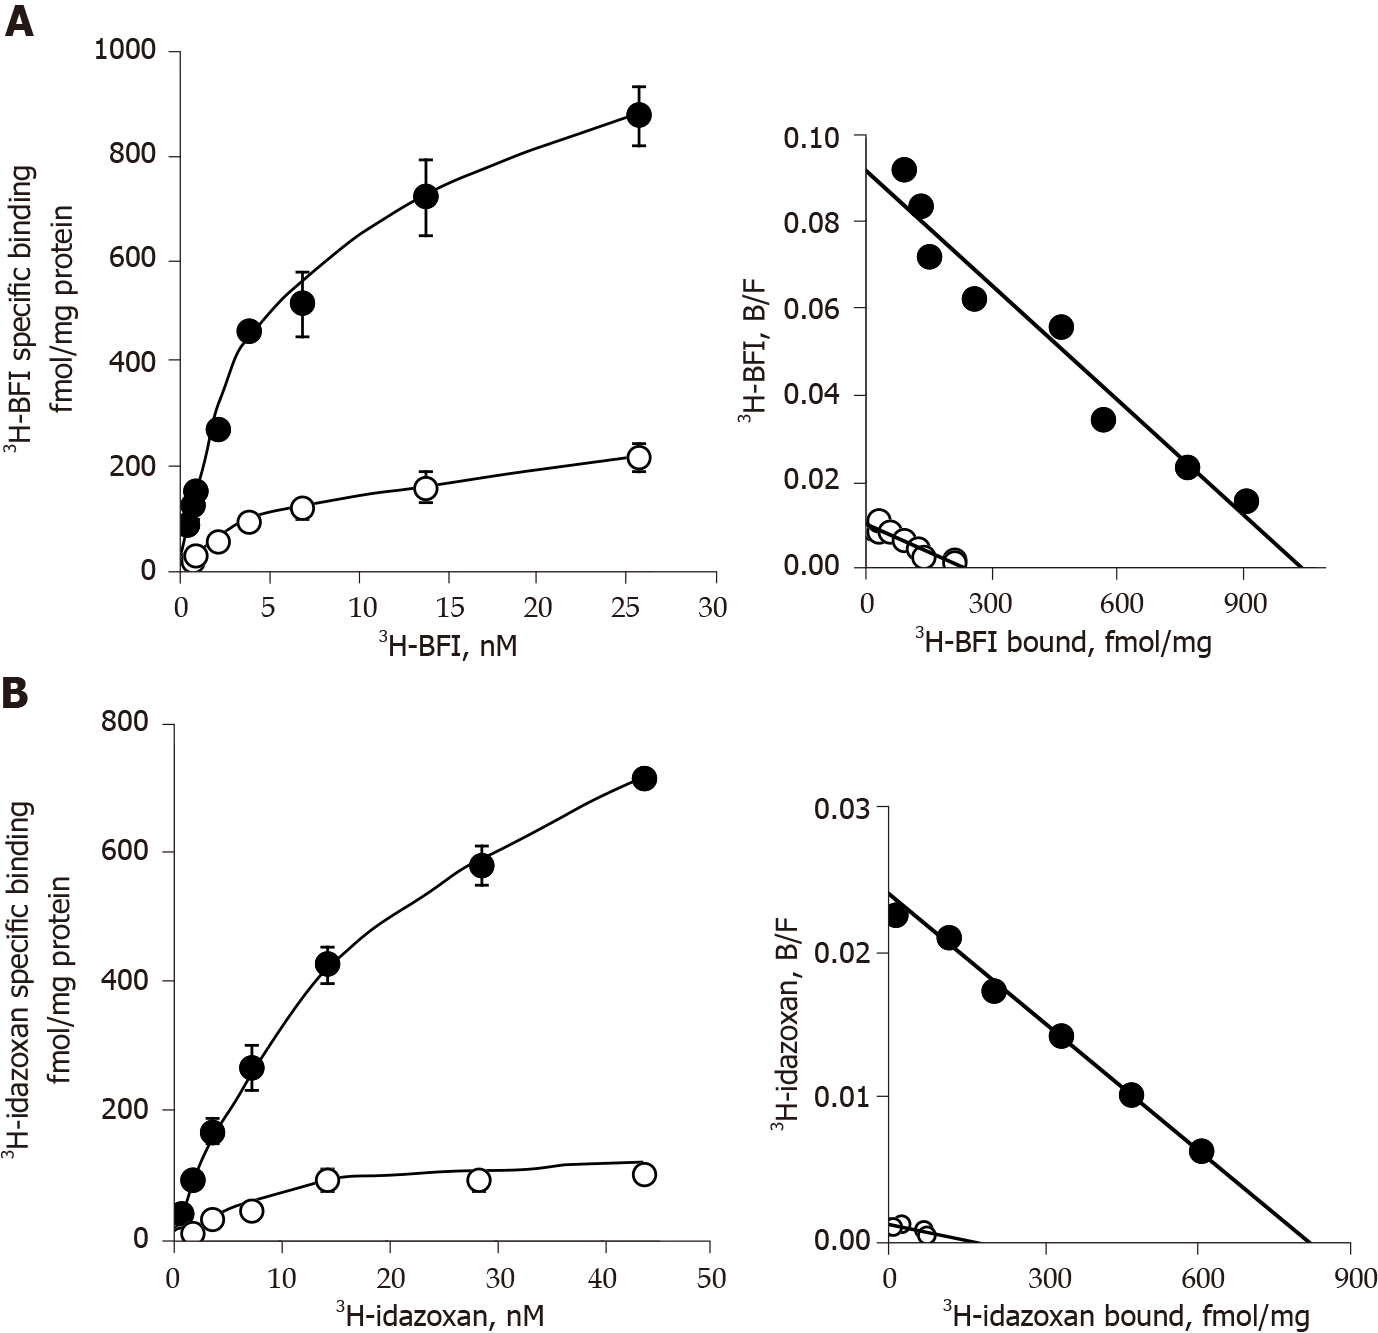
Figure 7 Saturation binding analysis with 3H-2-(2-benzofuranyl)-2-imidazoline and 3H-idazoxan in adipocyte membranes from white subcutaneous adipose tissue of lean and obese rats.
A and B: Adipocyte membranes from subcutaneous white adipose tissue of lean (open circles) or obese (dark circles) littermates were incubated for 45 min with increasing concentrations of 3H-2-(2-benzofuranyl)-2-imidazoline alone (A) or 3H-idazoxan plus 10 µmol/L rauwolscine (B). For each tested concentration, total binding was measured in the absence of any competitor while non-specific binding was determined in the presence of 100 µmol/L cirazoline. Left panels show the saturation curves of specific binding, with each point corresponding to the mean ± SEM of three separate saturation experiments. Right panels show the Scatchard plot (bound/free vs bound) of the saturation experiment for each radioligand. Calculated parameters of saturation experiments are reported in Table 2.
- Citation: Carpéné C, Marti L, Morin N. Increased monoamine oxidase activity and imidazoline binding sites in insulin-resistant adipocytes from obese Zucker rats . World J Biol Chem 2022; 13(1): 15-34
- URL: https://www.wjgnet.com/1949-8454/full/v13/i1/15.htm
- DOI: https://dx.doi.org/10.4331/wjbc.v13.i1.15


