Copyright
©2010 Baishideng Publishing Group Co.
World J Biol Chem. Sep 26, 2010; 1(9): 281-285
Published online Sep 26, 2010. doi: 10.4331/wjbc.v1.i9.281
Published online Sep 26, 2010. doi: 10.4331/wjbc.v1.i9.281
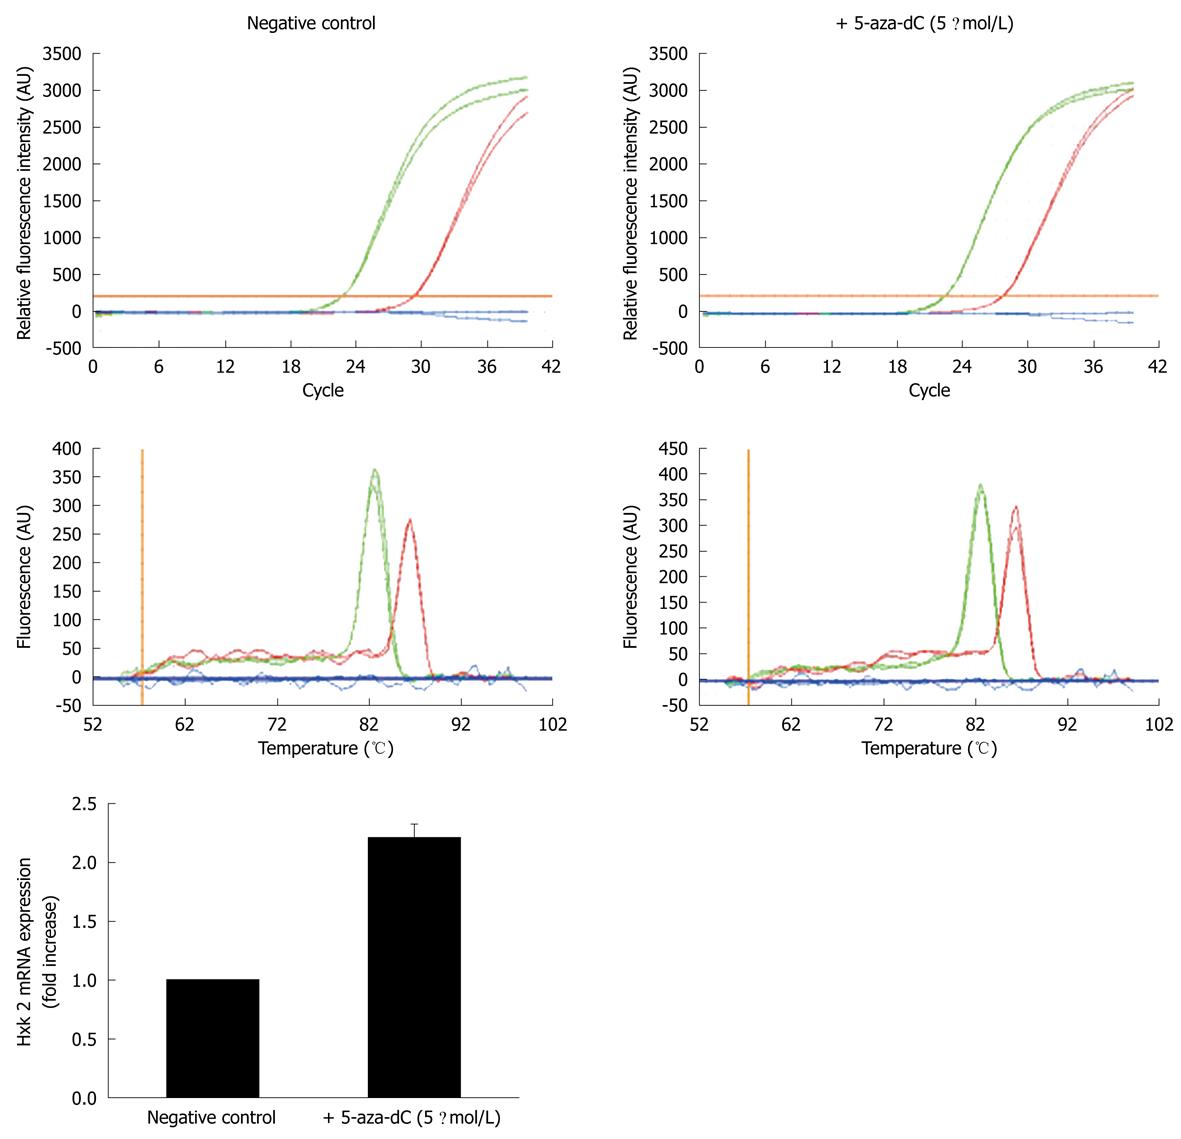
Figure 2 Quantitative real time polymerase chain reaction amplification profiles of GAPDH (green line), Hxk 2 (red line) and PDX-1 (blue line), and relative melting curves from total RNA of Clone-9 hepatocytes grown with or without 5 μmol/L 5-aza-deoxycytidine for 4 d.
In the graphic representation below, data from at least three independent experiments that used different RNA preparations were normalized vs the negative control (mean ± SD); the Hxk 2 mRNA levels increase when cells are cultured in the presence of the drug, as expected, but no increase in the PDX-1 mRNA was observed. 5-aza-dC: 5-aza-deoxycytidine.
- Citation: Pillich RT, Scarsella G, Risuleo G. Regeneration and DNA demethylation do not trigger PDX-1 expression in rat hepatocytes. World J Biol Chem 2010; 1(9): 281-285
- URL: https://www.wjgnet.com/1949-8454/full/v1/i9/281.htm
- DOI: https://dx.doi.org/10.4331/wjbc.v1.i9.281


