Copyright
©2010 Baishideng Publishing Group Co.
World J Gastrointest Surg. Nov 27, 2010; 2(11): 373-380
Published online Nov 27, 2010. doi: 10.4240/wjgs.v2.i11.373
Published online Nov 27, 2010. doi: 10.4240/wjgs.v2.i11.373
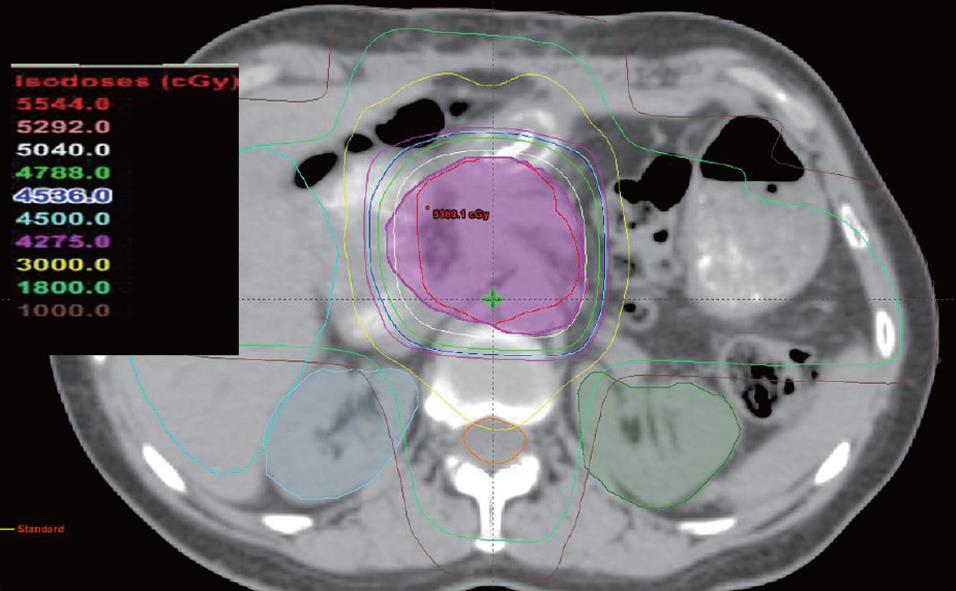
Figure 3 Axial isodose plot showing typical isodose distribution in the retroperitoneal region illustrating sparing of the kidneys from high radiation dose.
- Citation: Iott M, Neben-Wittich M, Quevedo JF, Miller RC. Adjuvant chemoradiotherapy for resected pancreas cancer. World J Gastrointest Surg 2010; 2(11): 373-380
- URL: https://www.wjgnet.com/1948-9366/full/v2/i11/373.htm
- DOI: https://dx.doi.org/10.4240/wjgs.v2.i11.373


