Copyright
©The Author(s) 2025.
World J Gastrointest Surg. Apr 27, 2025; 17(4): 102934
Published online Apr 27, 2025. doi: 10.4240/wjgs.v17.i4.102934
Published online Apr 27, 2025. doi: 10.4240/wjgs.v17.i4.102934
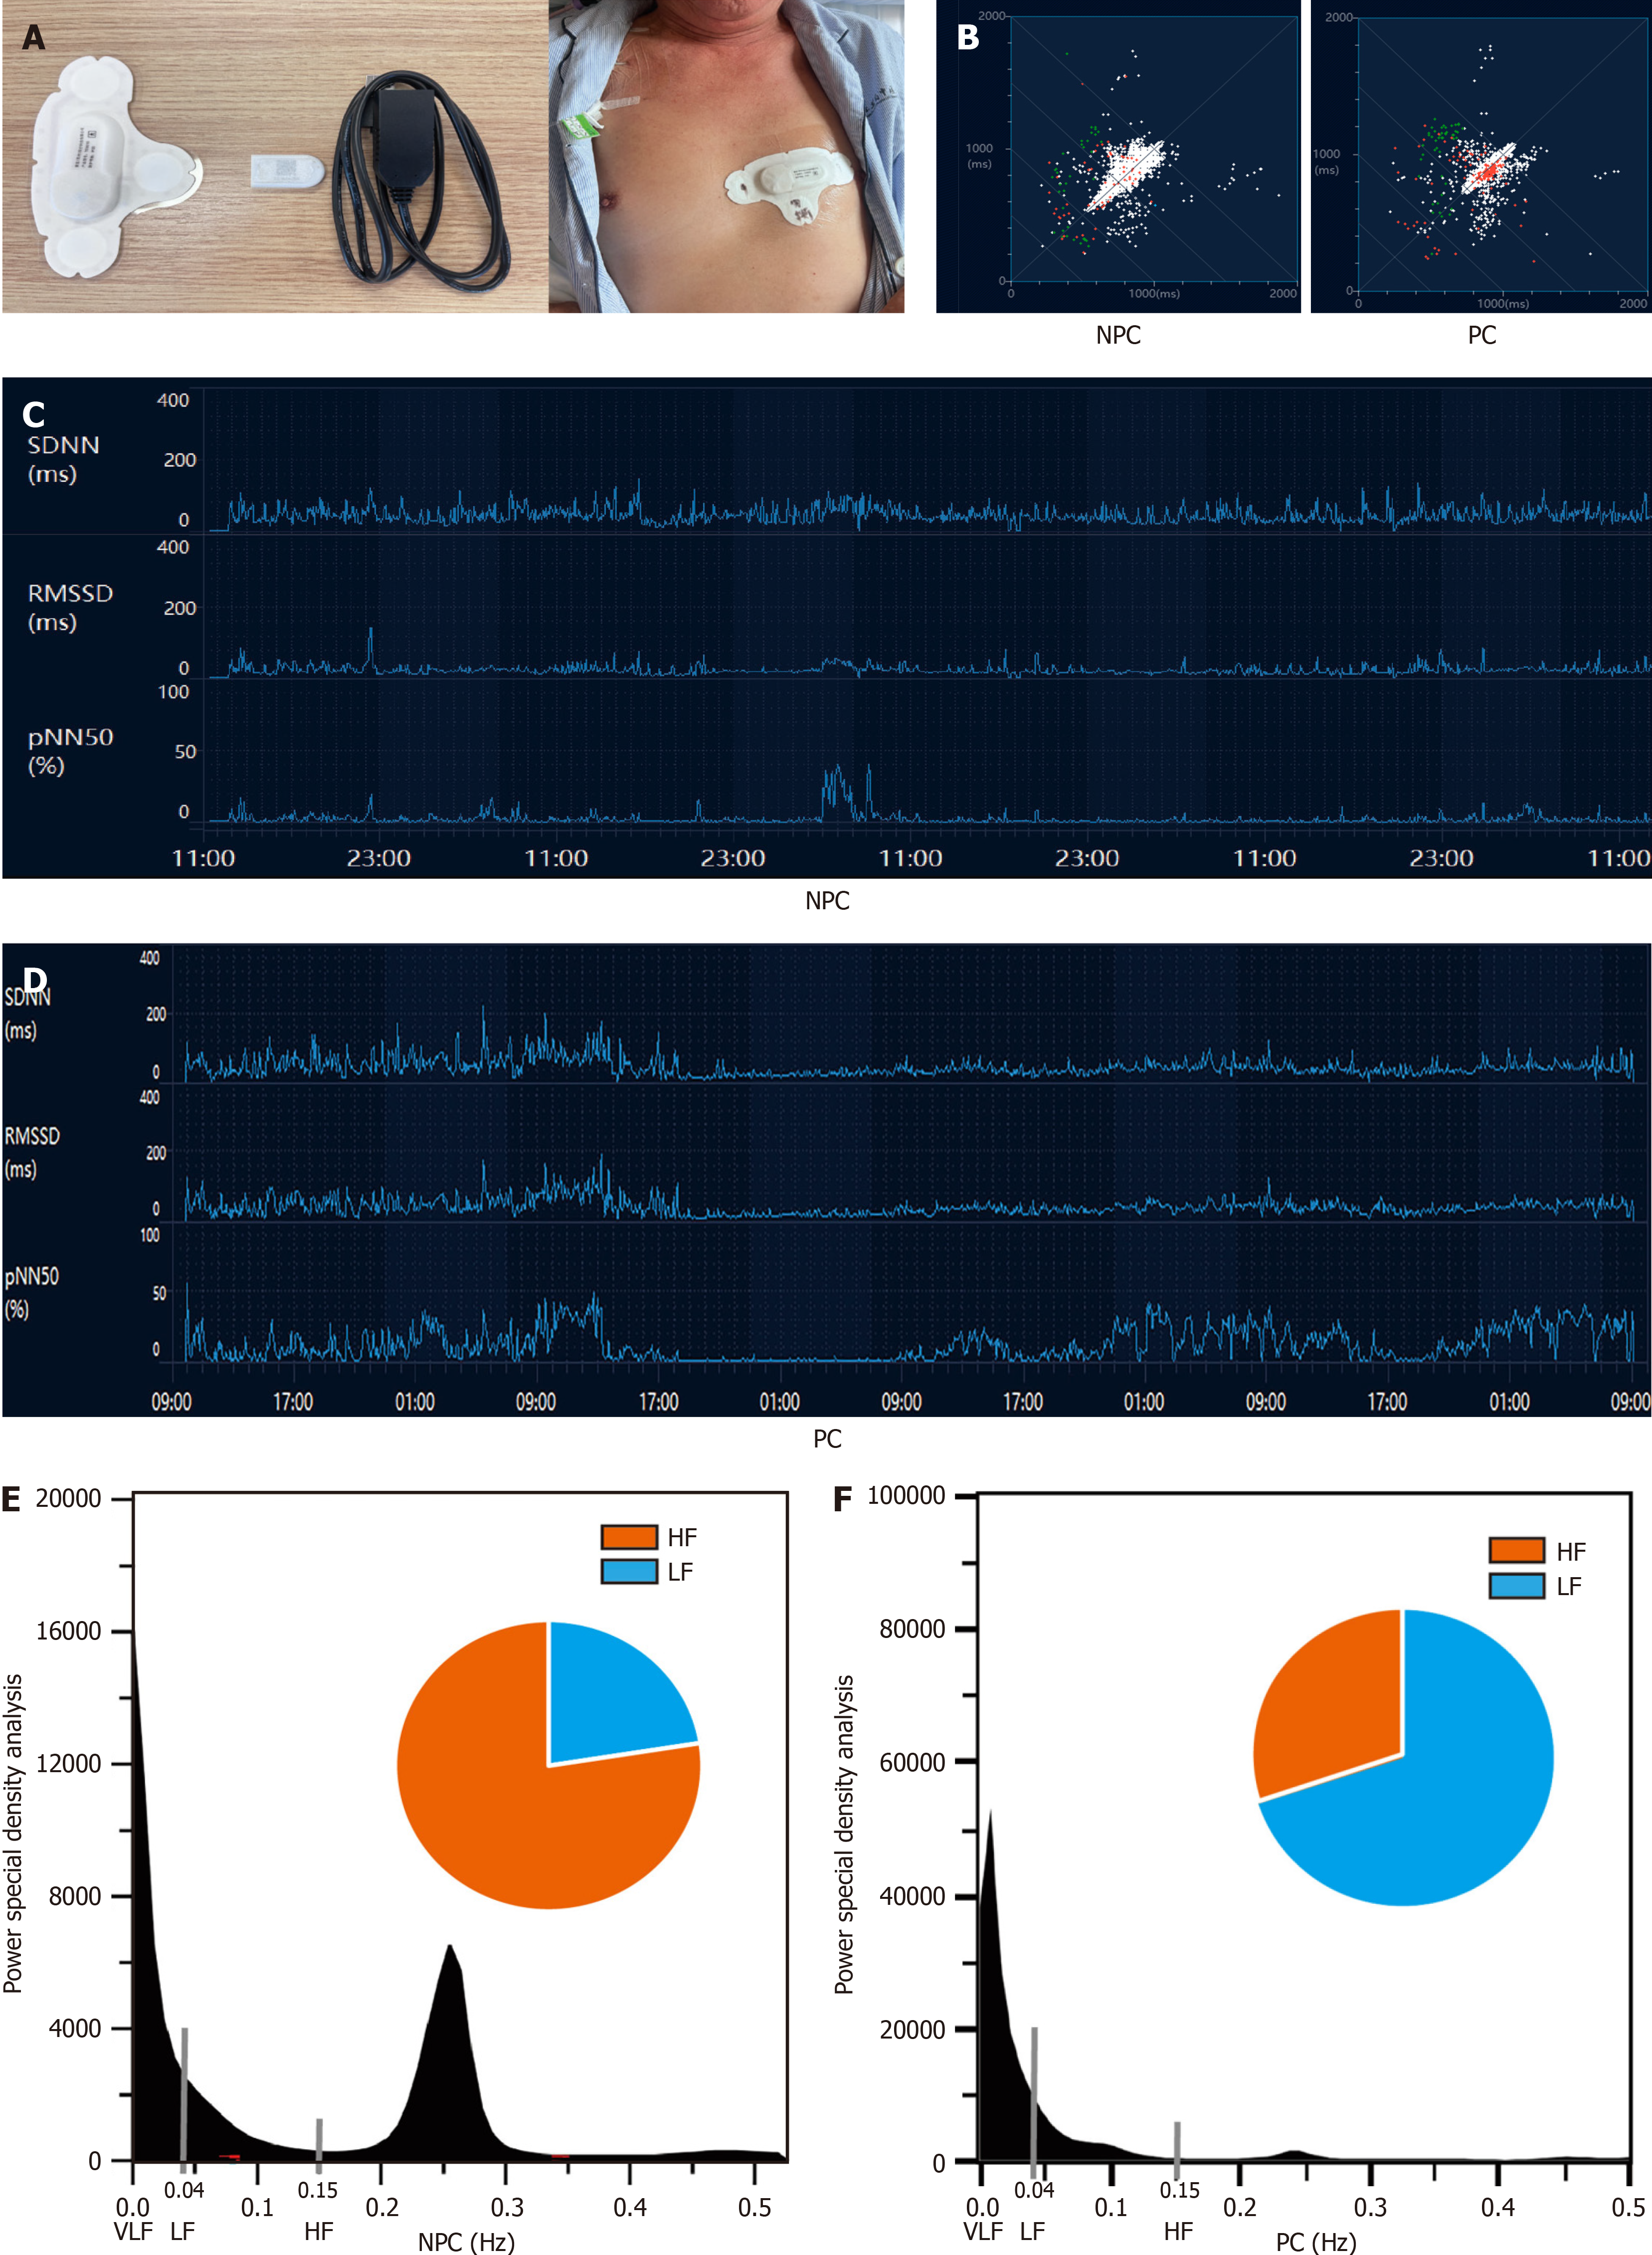
Figure 1 Heart rate variability in a normal and abnormal state.
A: A smart monitoring device for the collection of heart rate variability data; B: Poincaré scatter diagram in a relaxed and stressed state; C and D: Trend chart of time-domain parameters indicating the difference 24 hours before the operation to 3 days after the operation; E and F: Power spectral density analysis of the frequency domain indicates the difference between the non-perioperative complication group and the perioperative complication group. NPC: Non-perioperative complication; PC: Perioperative complication; HF: High-frequency; LF: Low-frequency.
- Citation: Ge MM, Wang LW, Wang J, Liu J, Chen P, Liu XX, Wang G, Gong GW, Jiang ZW. Prediction of perioperative complications in colorectal cancer via artificial intelligence analysis of heart rate variability. World J Gastrointest Surg 2025; 17(4): 102934
- URL: https://www.wjgnet.com/1948-9366/full/v17/i4/102934.htm
- DOI: https://dx.doi.org/10.4240/wjgs.v17.i4.102934


