


Copyright
©The Author(s) 2025.
World J Gastrointest Surg. Mar 27, 2025; 17(3): 102190
Published online Mar 27, 2025. doi: 10.4240/wjgs.v17.i3.102190
Published online Mar 27, 2025. doi: 10.4240/wjgs.v17.i3.102190

Figure 1 Learning curve.
The samples were sorted according to the order of surgery and the serial number was edited. The % scatter plot was drawn with cumulative summation value as the vertical axis and the number of cases as the horizontal axis. CUSUM: Cumulative summation, 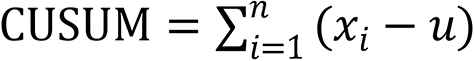 .
.
.
- Citation: Yang QS, Zhang M, Ma CS, Teng D, Li A, Dong JD, Wang XF, Liu FB. Analysis of risk factors for bile leakage after laparoscopic exploration and primary suture of common bile duct. World J Gastrointest Surg 2025; 17(3): 102190
- URL: https://www.wjgnet.com/1948-9366/full/v17/i3/102190.htm
- DOI: https://dx.doi.org/10.4240/wjgs.v17.i3.102190