Copyright
©The Author(s) 2025.
World J Gastrointest Surg. Feb 27, 2025; 17(2): 98585
Published online Feb 27, 2025. doi: 10.4240/wjgs.v17.i2.98585
Published online Feb 27, 2025. doi: 10.4240/wjgs.v17.i2.98585
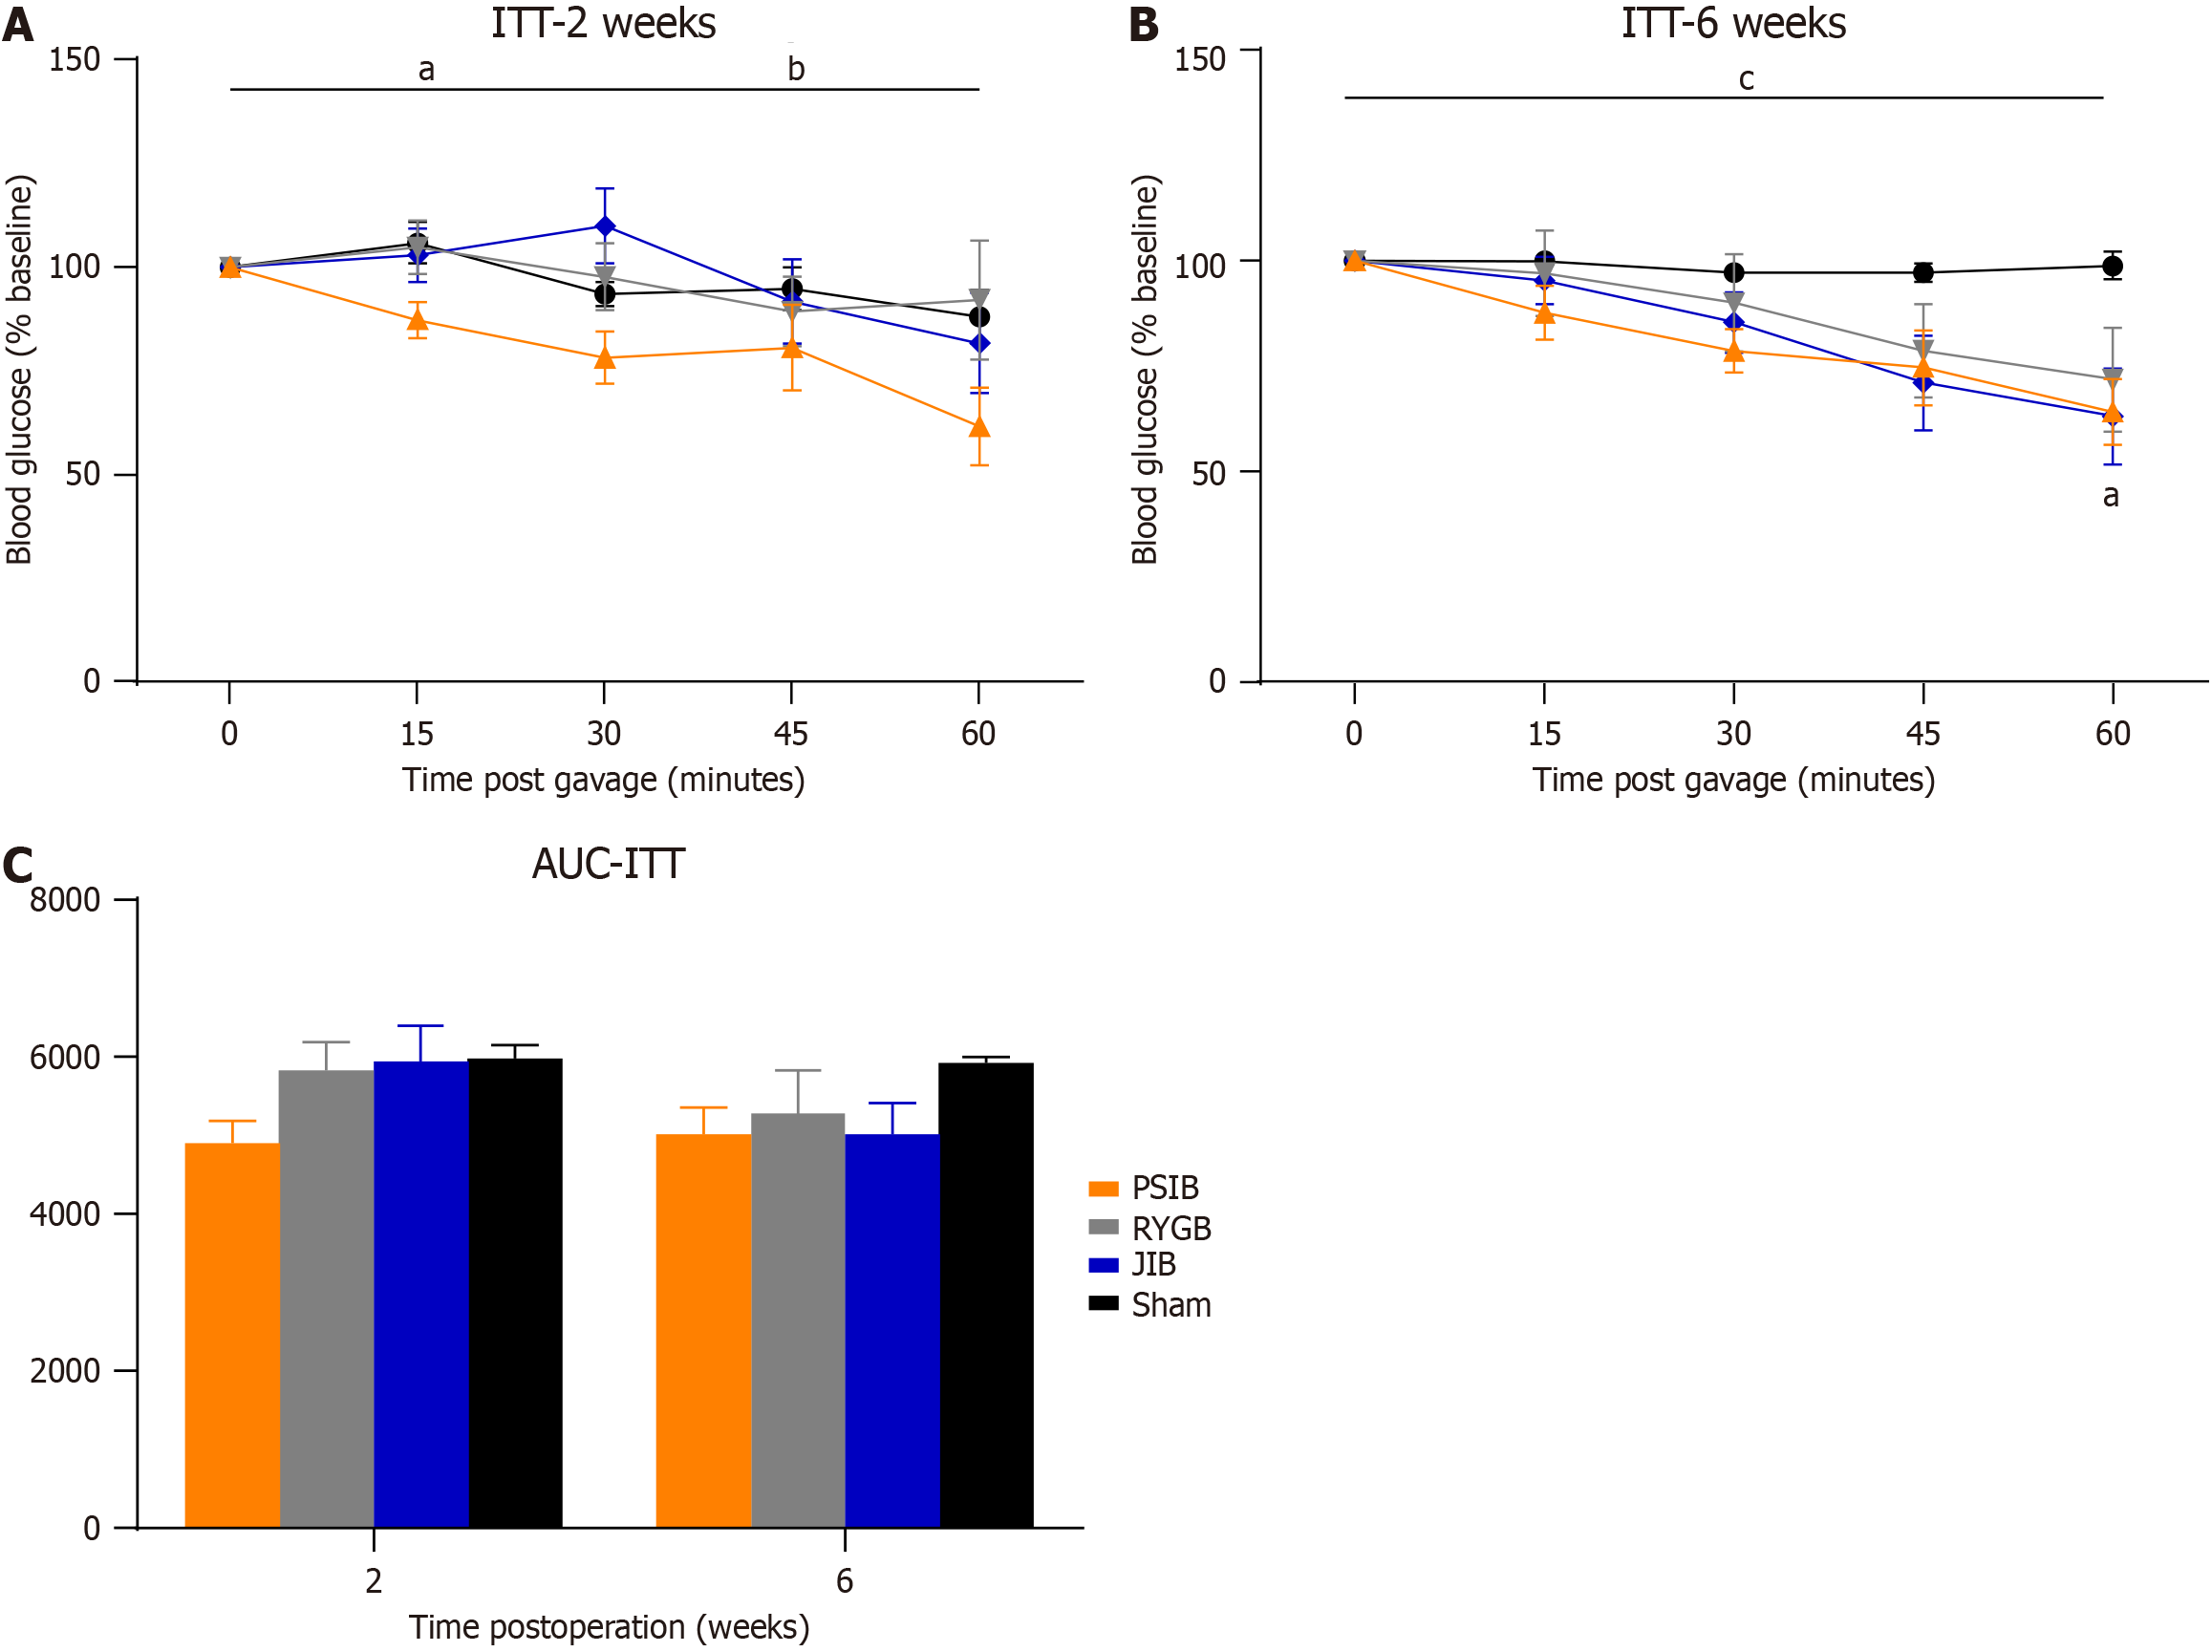
Figure 4 Insulin tolerance test.
A: Insulin tolerance test (ITT) at 2 weeks postoperatively; B: ITT at 6 weeks postoperatively; C: Area under the curve of ITT values. Data are presented as means ± SE. aP < 0.05, proximal small intestinal bypass vs sham; bP < 0.05, proximal small intestinal bypass vs Roux-en-Y gastric bypass and jejunoileal bypass; cP < 0.05, proximal small intestinal bypass and jejunoileal bypass vs sham. ITT: Insulin tolerance test; AUC-ITT: Area under the insulin tolerance test curve; PSIB: Proximal small intestinal bypass; RYGB: Roux-en-Y gastric bypass; JIB: Jejunoileal bypass.
- Citation: Xu CY, Tan C, Luo X, Yang K, Wu RR, Lin L, Liu GL, Duan JY. Proximal small intestinal bypass outperforms Roux-en-Y and jejunoileal bypass in glucose regulation in streptozotocin induced diabetic rats. World J Gastrointest Surg 2025; 17(2): 98585
- URL: https://www.wjgnet.com/1948-9366/full/v17/i2/98585.htm
- DOI: https://dx.doi.org/10.4240/wjgs.v17.i2.98585


