Copyright
©The Author(s) 2025.
World J Gastrointest Surg. Jan 27, 2025; 17(1): 97148
Published online Jan 27, 2025. doi: 10.4240/wjgs.v17.i1.97148
Published online Jan 27, 2025. doi: 10.4240/wjgs.v17.i1.97148
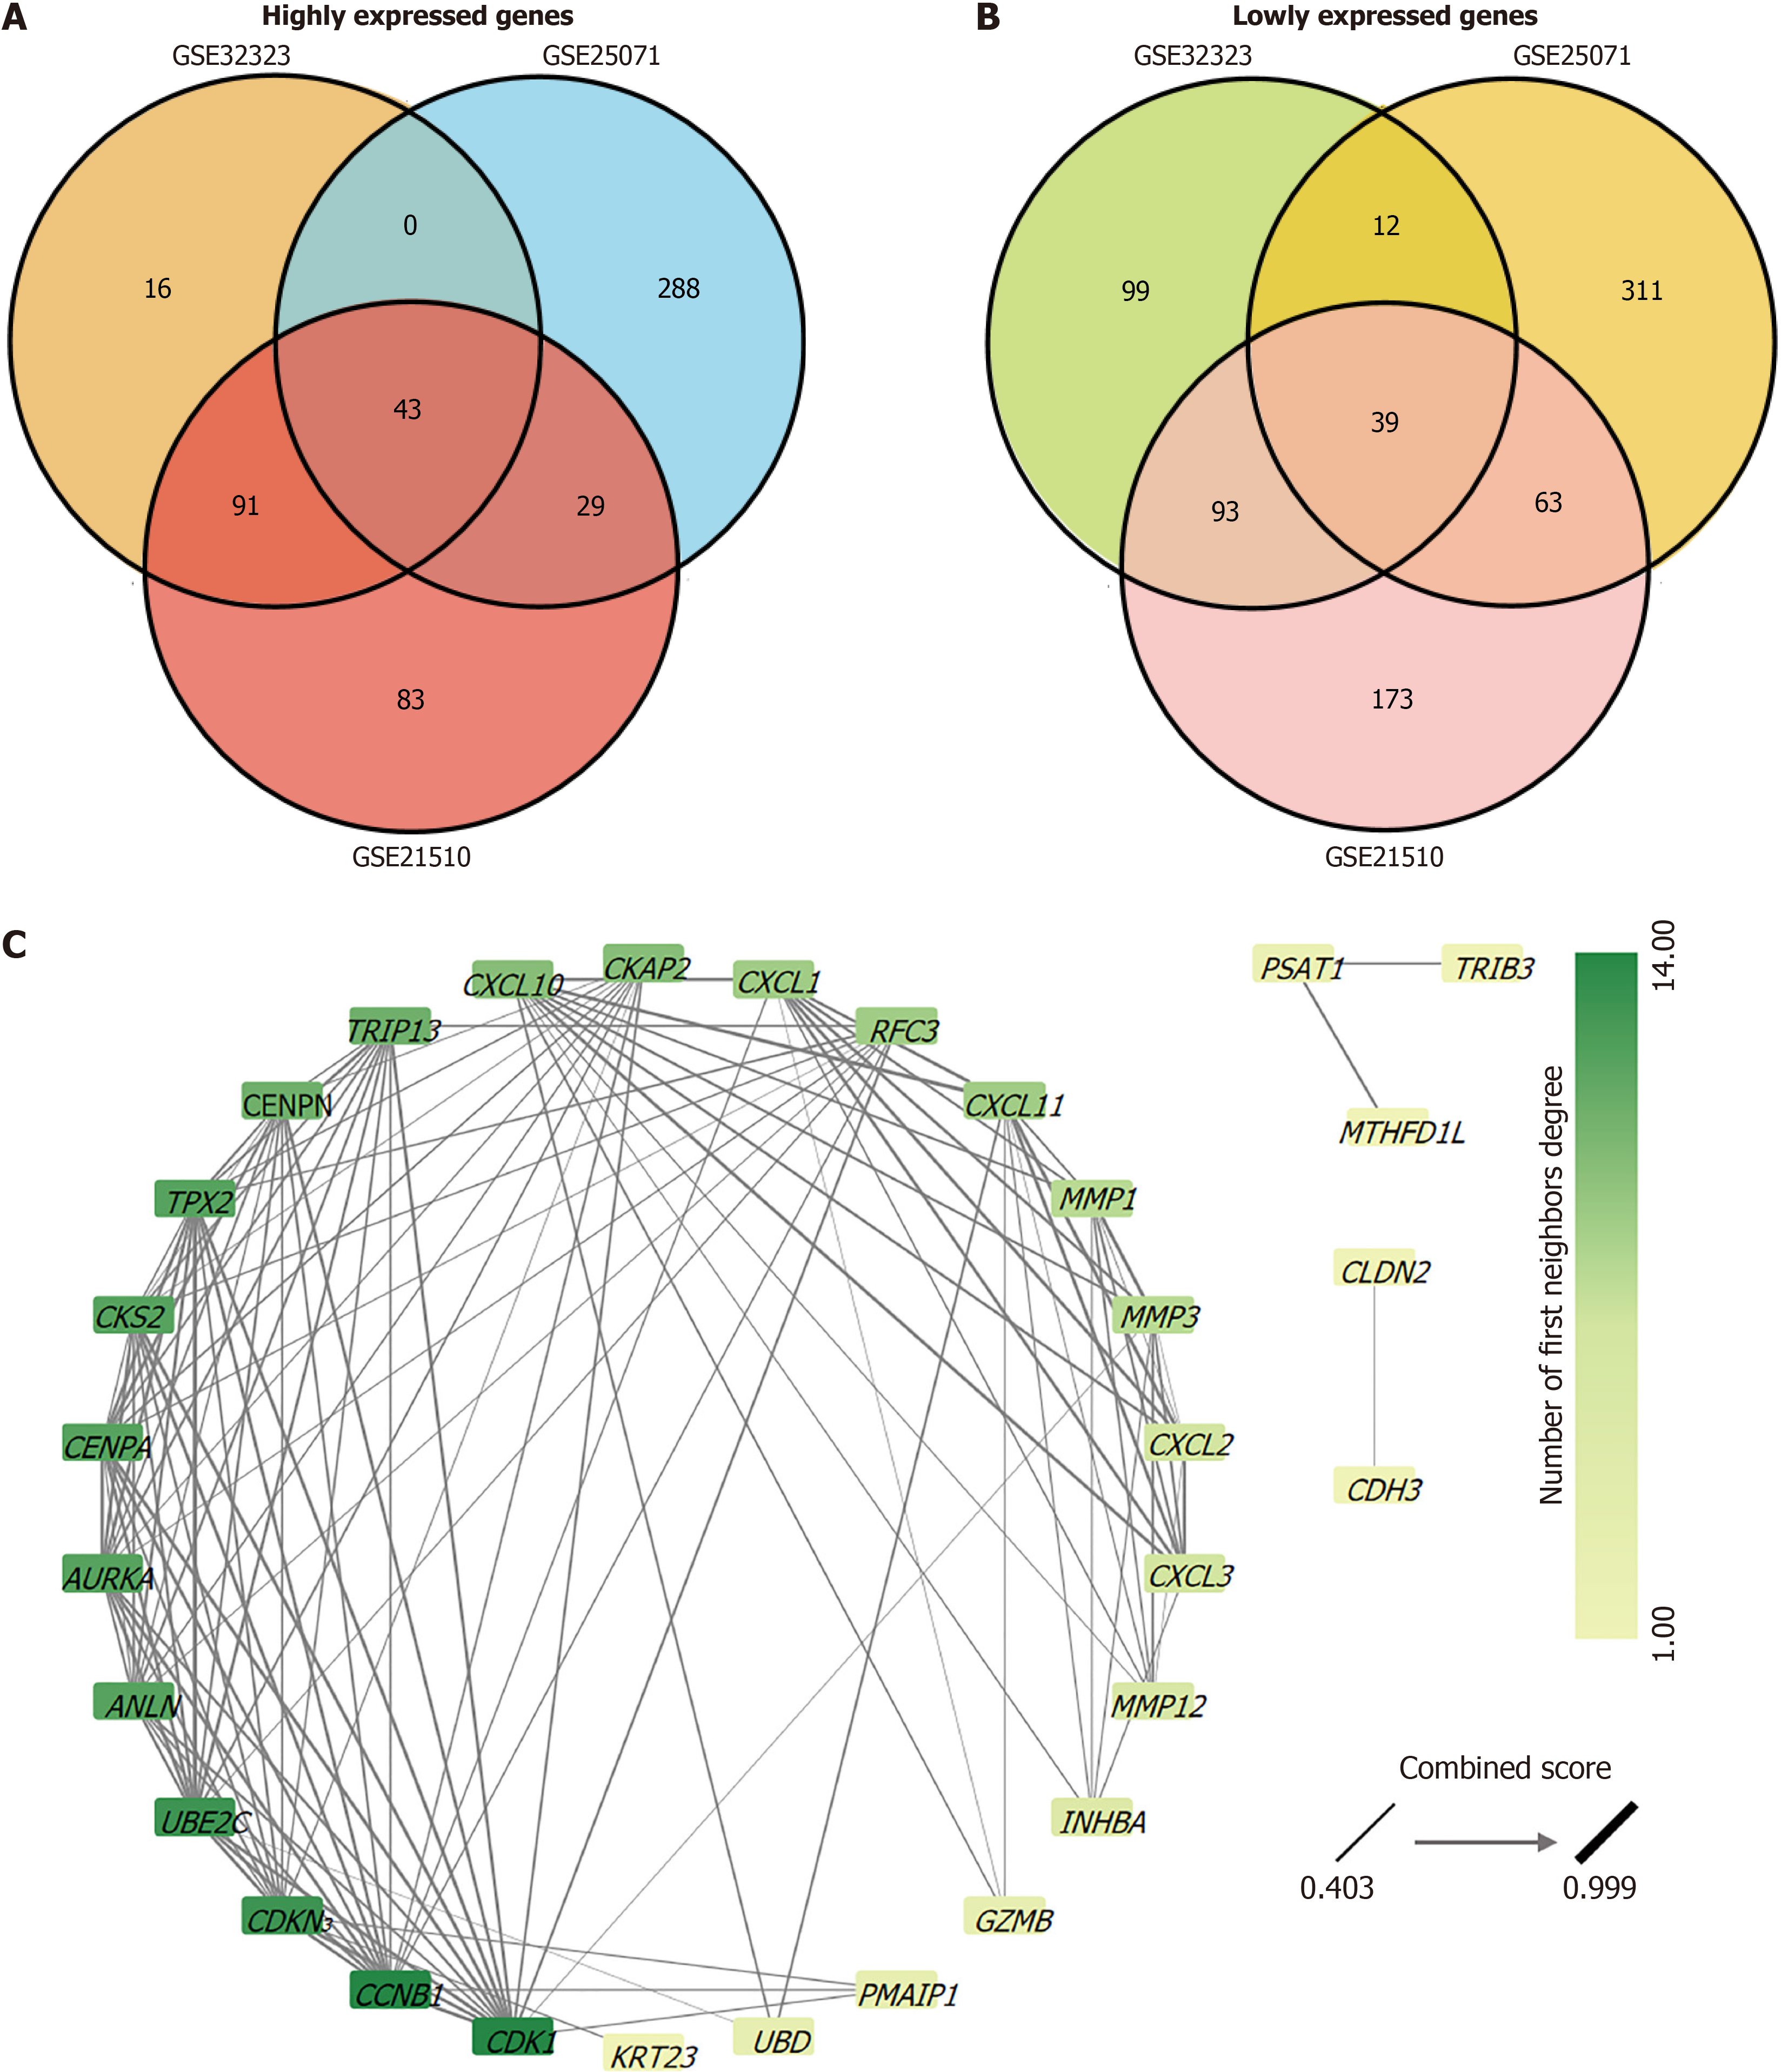
Figure 1 Protein-protein interaction network of highly expressed genes in colorectal cancer tissues.
A: A Venn diagram showed the number of relative highly expressed genes from the GSE32323, GSE25071, and GSE21510 datasets. These gene expressions were increased in colorectal cancer (CRC) tissues compared to normal tissues and an intersection of 43 genes was identified across all three datasets; B: A Venn diagram showed the number of genes with relatively low expression from GSE32323, GSE25071, and GSE21510. These gene expressions were decreased in CRC tissues compared to normal tissues and an intersection of 39 genes was identified across all three datasets. All genes were screened for |Log2 (fold change)|> 2 and adjusted P value < 0.05; C: The topology of the protein-protein interaction network was analyzed by Cytoscape and the network was established based on 43 genes from an intersection of relative overexpressed genes from the GSE32323, GSE25071, and GSE21510 datasets. The greater the adjacent node count, the darker the green; the thicker the edges, the stronger the interaction force.
- Citation: Sheng GX, Zhang YJ, Shang T. Synergistic inhibition of colorectal cancer progression by silencing Aurora A and the targeting protein for Xklp2. World J Gastrointest Surg 2025; 17(1): 97148
- URL: https://www.wjgnet.com/1948-9366/full/v17/i1/97148.htm
- DOI: https://dx.doi.org/10.4240/wjgs.v17.i1.97148


