Copyright
©The Author(s) 2024.
World J Gastrointest Surg. Aug 27, 2024; 16(8): 2630-2639
Published online Aug 27, 2024. doi: 10.4240/wjgs.v16.i8.2630
Published online Aug 27, 2024. doi: 10.4240/wjgs.v16.i8.2630
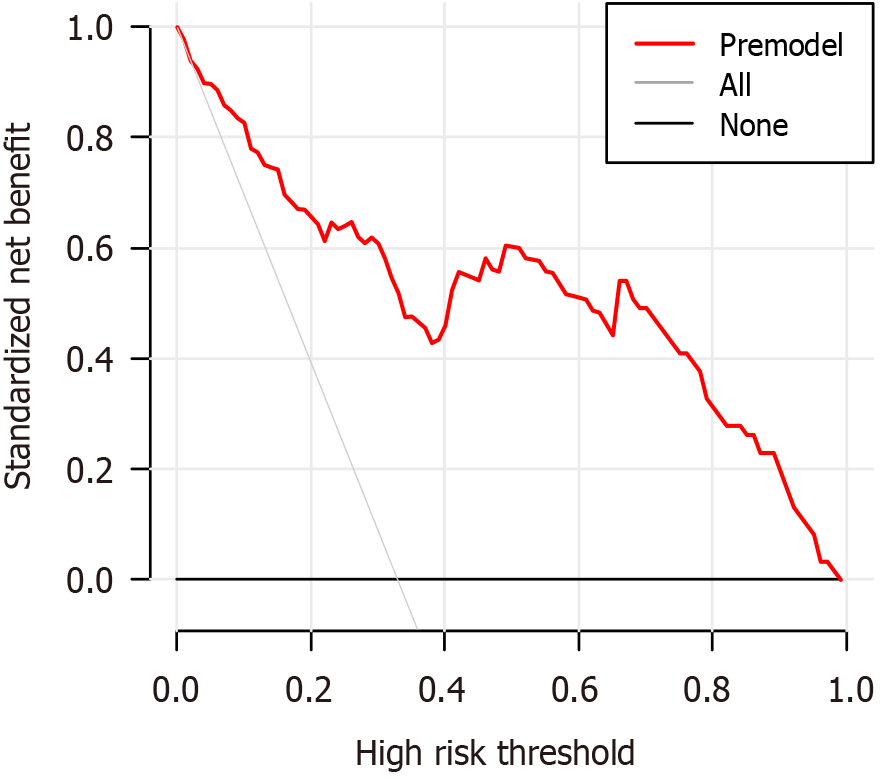
Figure 4 Analysis of the decision curve for the predictive model.
The net benefit was produced against the high-risk threshold. The solid red line represents the prediction model. The decision curve shows that when the threshold probability is < 85%, the implementation of this predictive model would add a net benefit compared with either the treat-all or the treat-none strategies.
- Citation: Shen HH, Hong YR, Xu W, Chen L, Chen JM, Yang ZG, Chen CH. Nomogram predicting the prognosis of primary liver cancer after radiofrequency ablation combined with transcatheter arterial chemoembolization. World J Gastrointest Surg 2024; 16(8): 2630-2639
- URL: https://www.wjgnet.com/1948-9366/full/v16/i8/2630.htm
- DOI: https://dx.doi.org/10.4240/wjgs.v16.i8.2630


