Copyright
©The Author(s) 2024.
World J Gastrointest Surg. Aug 27, 2024; 16(8): 2630-2639
Published online Aug 27, 2024. doi: 10.4240/wjgs.v16.i8.2630
Published online Aug 27, 2024. doi: 10.4240/wjgs.v16.i8.2630
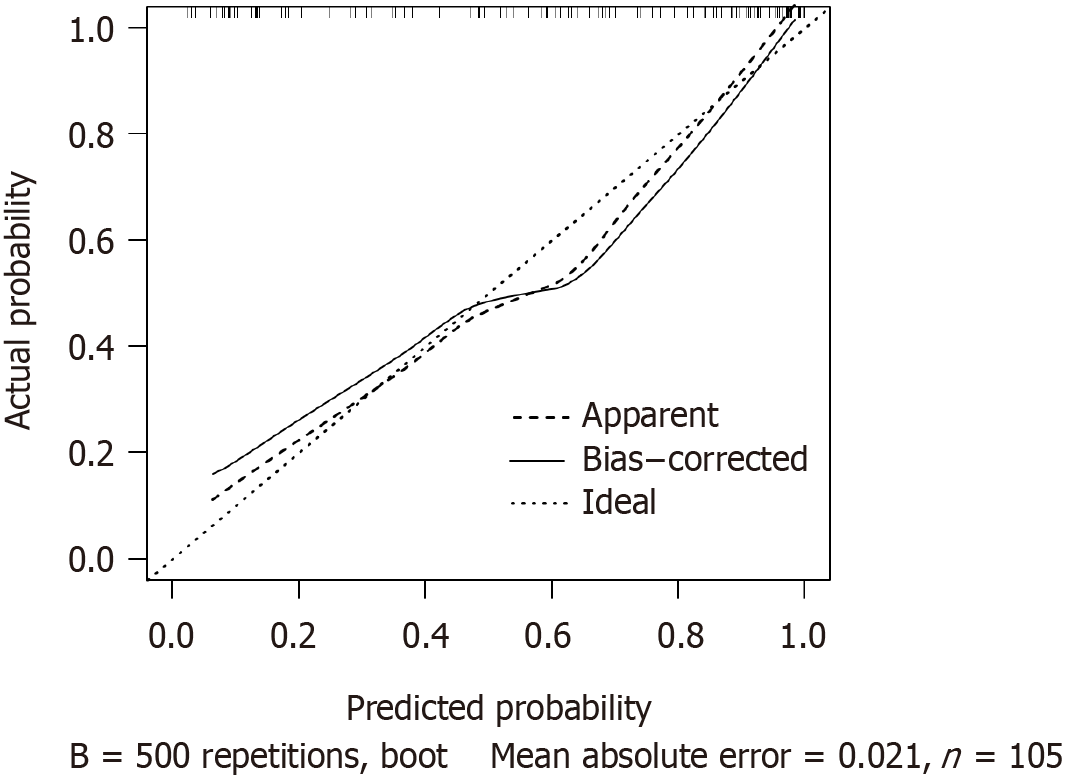
Figure 3 Calibration curve of the model.
The calibration of the model confirming the agreement between predicted and observed outcomes of post-treatment recurrent metastasis. The real post-treatment recurrent metastasis rate is represented on the Y-axis. The X-axis represents the expected risk of post-treatment recurrent metastasis. The closer the bias-corrected curve is to the ideal curve, the better the prediction effect.
- Citation: Shen HH, Hong YR, Xu W, Chen L, Chen JM, Yang ZG, Chen CH. Nomogram predicting the prognosis of primary liver cancer after radiofrequency ablation combined with transcatheter arterial chemoembolization. World J Gastrointest Surg 2024; 16(8): 2630-2639
- URL: https://www.wjgnet.com/1948-9366/full/v16/i8/2630.htm
- DOI: https://dx.doi.org/10.4240/wjgs.v16.i8.2630


