Copyright
©The Author(s) 2024.
World J Gastrointest Surg. Aug 27, 2024; 16(8): 2546-2554
Published online Aug 27, 2024. doi: 10.4240/wjgs.v16.i8.2546
Published online Aug 27, 2024. doi: 10.4240/wjgs.v16.i8.2546
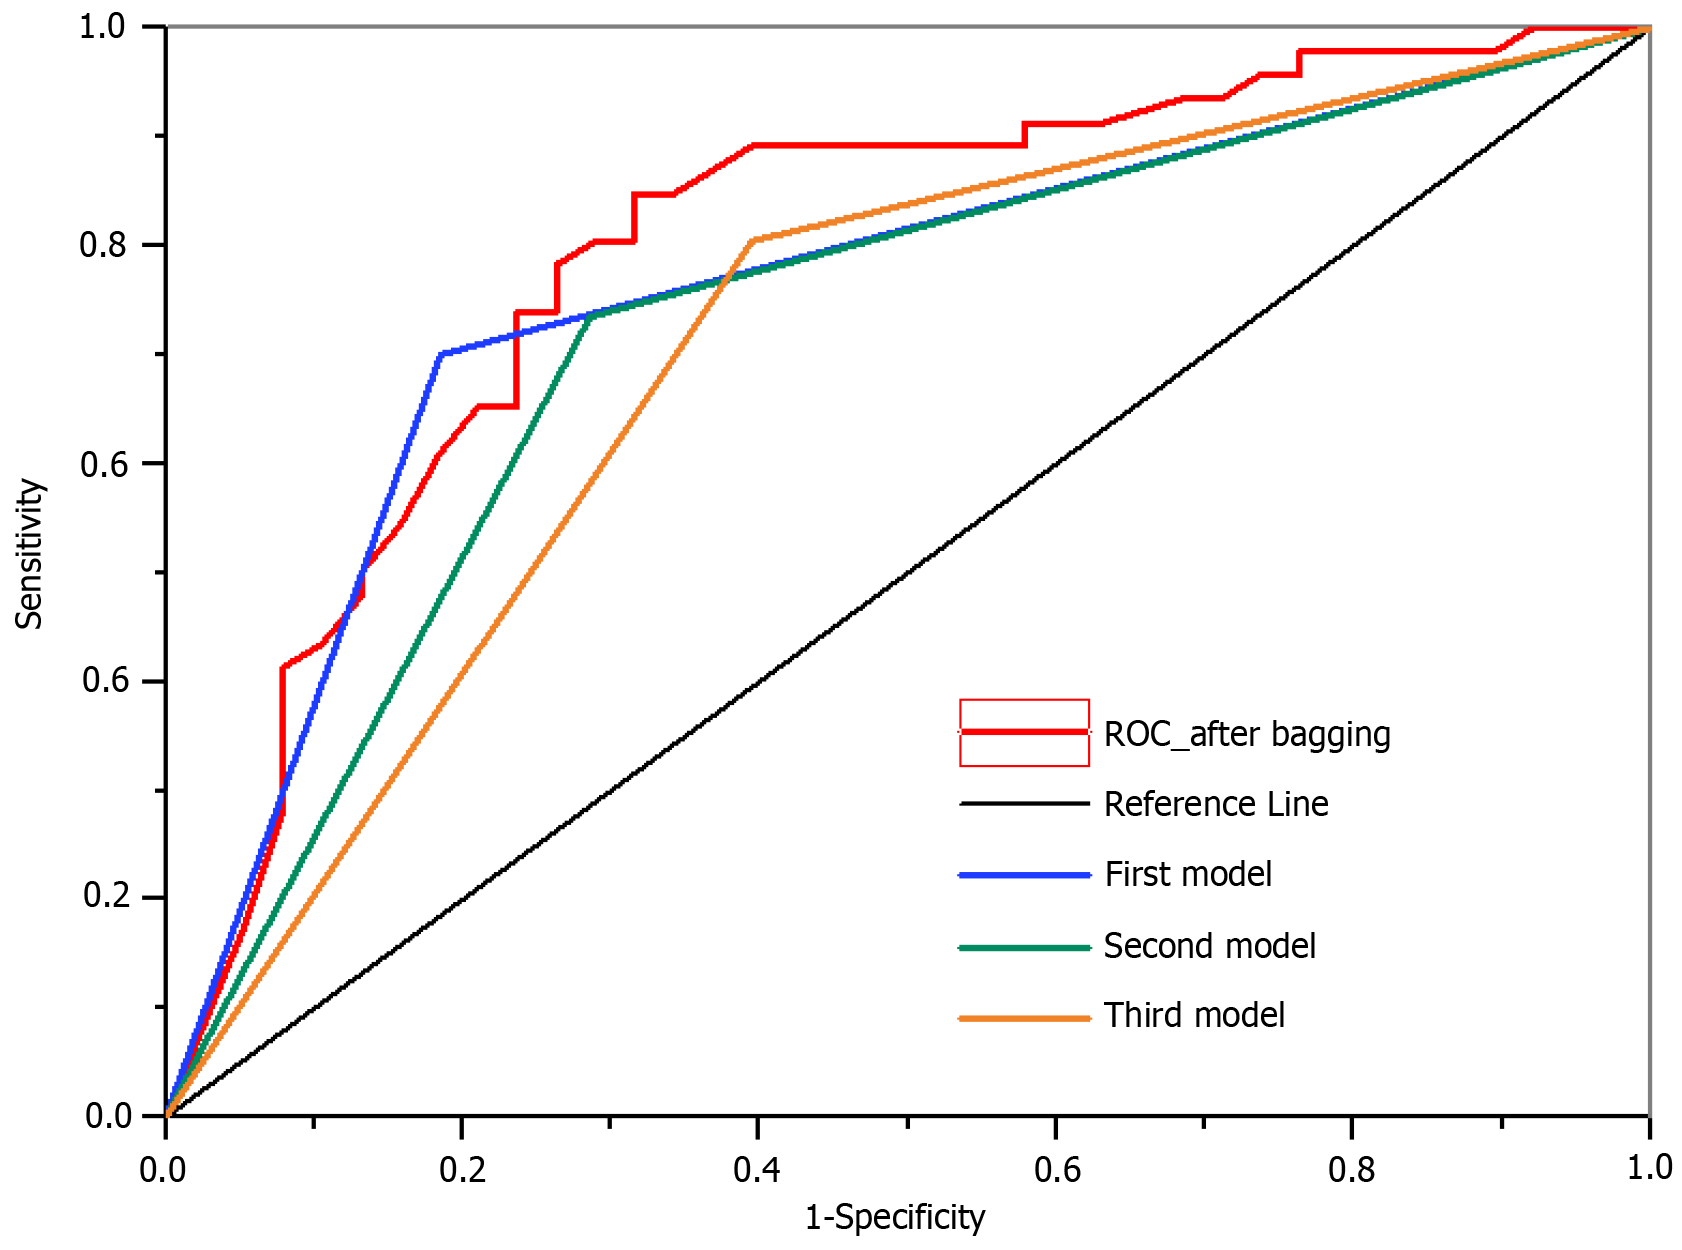
Figure 4 The results of the bagging strategy.
The red line represents achievement of area under the curve (AUC) of 0.79. The top three classifiers out of the 50 classifiers are represented by blue, green, and orange lines, corresponding to AUC values of 0.74, 0.73, and 0.71, respectively. ROC: Receiver operating characteristic.
- Citation: Xu JY, Yang YF, Huang ZY, Qian XY, Meng FH. Preoperative prediction of hepatocellular carcinoma microvascular invasion based on magnetic resonance imaging feature extraction artificial neural network. World J Gastrointest Surg 2024; 16(8): 2546-2554
- URL: https://www.wjgnet.com/1948-9366/full/v16/i8/2546.htm
- DOI: https://dx.doi.org/10.4240/wjgs.v16.i8.2546


