Copyright
©The Author(s) 2024.
World J Gastrointest Surg. Aug 27, 2024; 16(8): 2436-2450
Published online Aug 27, 2024. doi: 10.4240/wjgs.v16.i8.2436
Published online Aug 27, 2024. doi: 10.4240/wjgs.v16.i8.2436
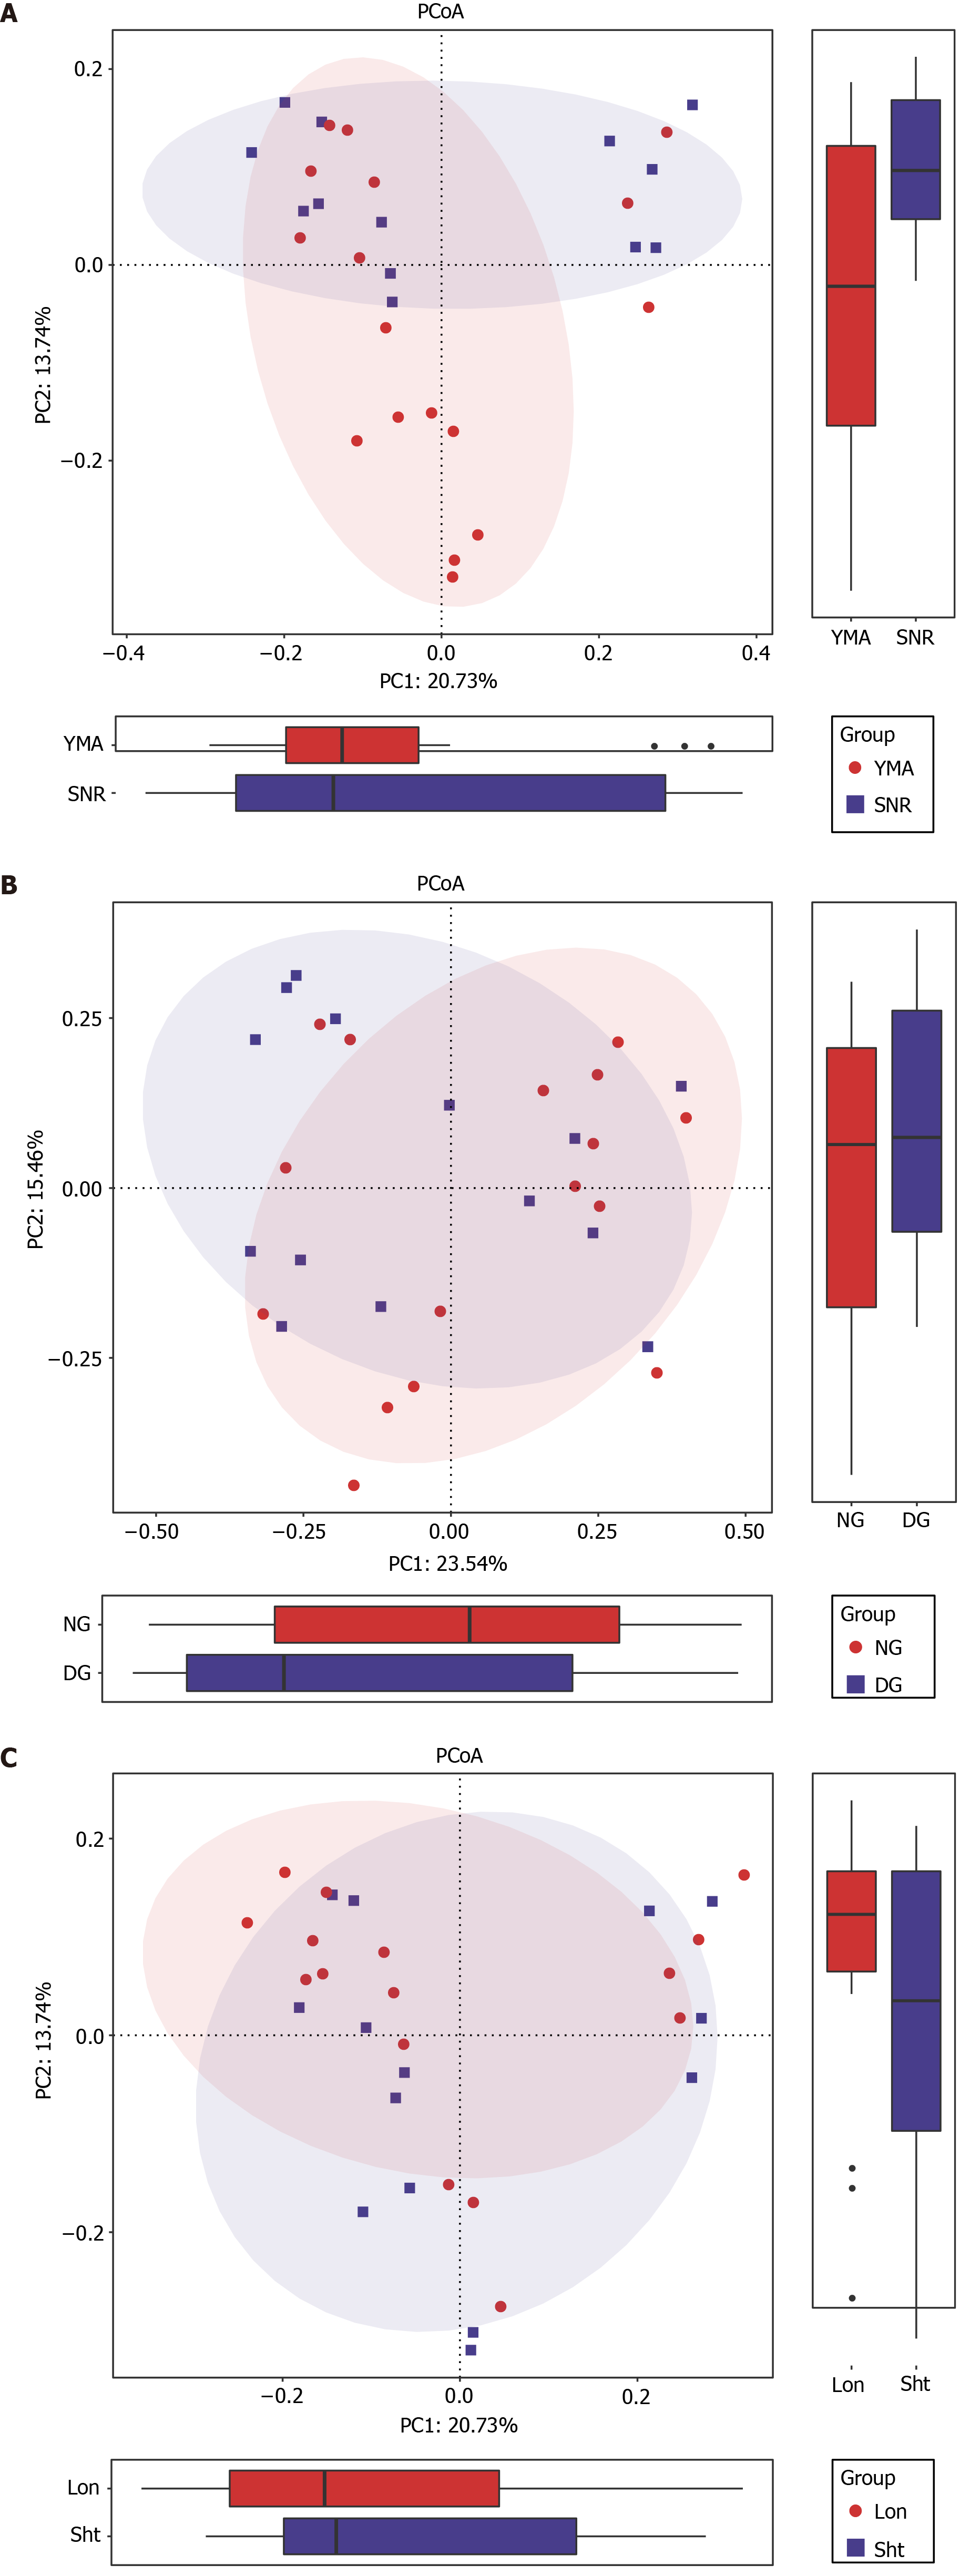
Figure 5 Examining beta diversity applying operational taxonomic units levels in subgroups.
A: Principal coordinate analysis (PCoA) plots based on Unweighted UniFrac distances of patients over 60 years and patients under 60 years groups; B: PCoA plots based on Bray-Curtis distances of patients had diarrhea and patients without diarrhea groups; C: PCoA plots based on Unweighted Unifrac distances of post-operative patients over 5 years and post-operative patients less than 5 years groups. YMA: Patients over 60 years; SNR: Patients under 60 years; DG: Patients had diarrhea; NG: Patients without diarrhea; Lon: Post-operative patients over 5 years; Sht: Post-operative patients less than 5 years; PCoA: Principal coordinate analysis.
- Citation: Fan MY, Jiang QL, Cui MY, Zhao MQ, Wang JJ, Lu YY. Alteration of ascending colon mucosal microbiota in patients after cholecystectomy. World J Gastrointest Surg 2024; 16(8): 2436-2450
- URL: https://www.wjgnet.com/1948-9366/full/v16/i8/2436.htm
- DOI: https://dx.doi.org/10.4240/wjgs.v16.i8.2436


