Copyright
©The Author(s) 2024.
World J Gastrointest Surg. Aug 27, 2024; 16(8): 2436-2450
Published online Aug 27, 2024. doi: 10.4240/wjgs.v16.i8.2436
Published online Aug 27, 2024. doi: 10.4240/wjgs.v16.i8.2436
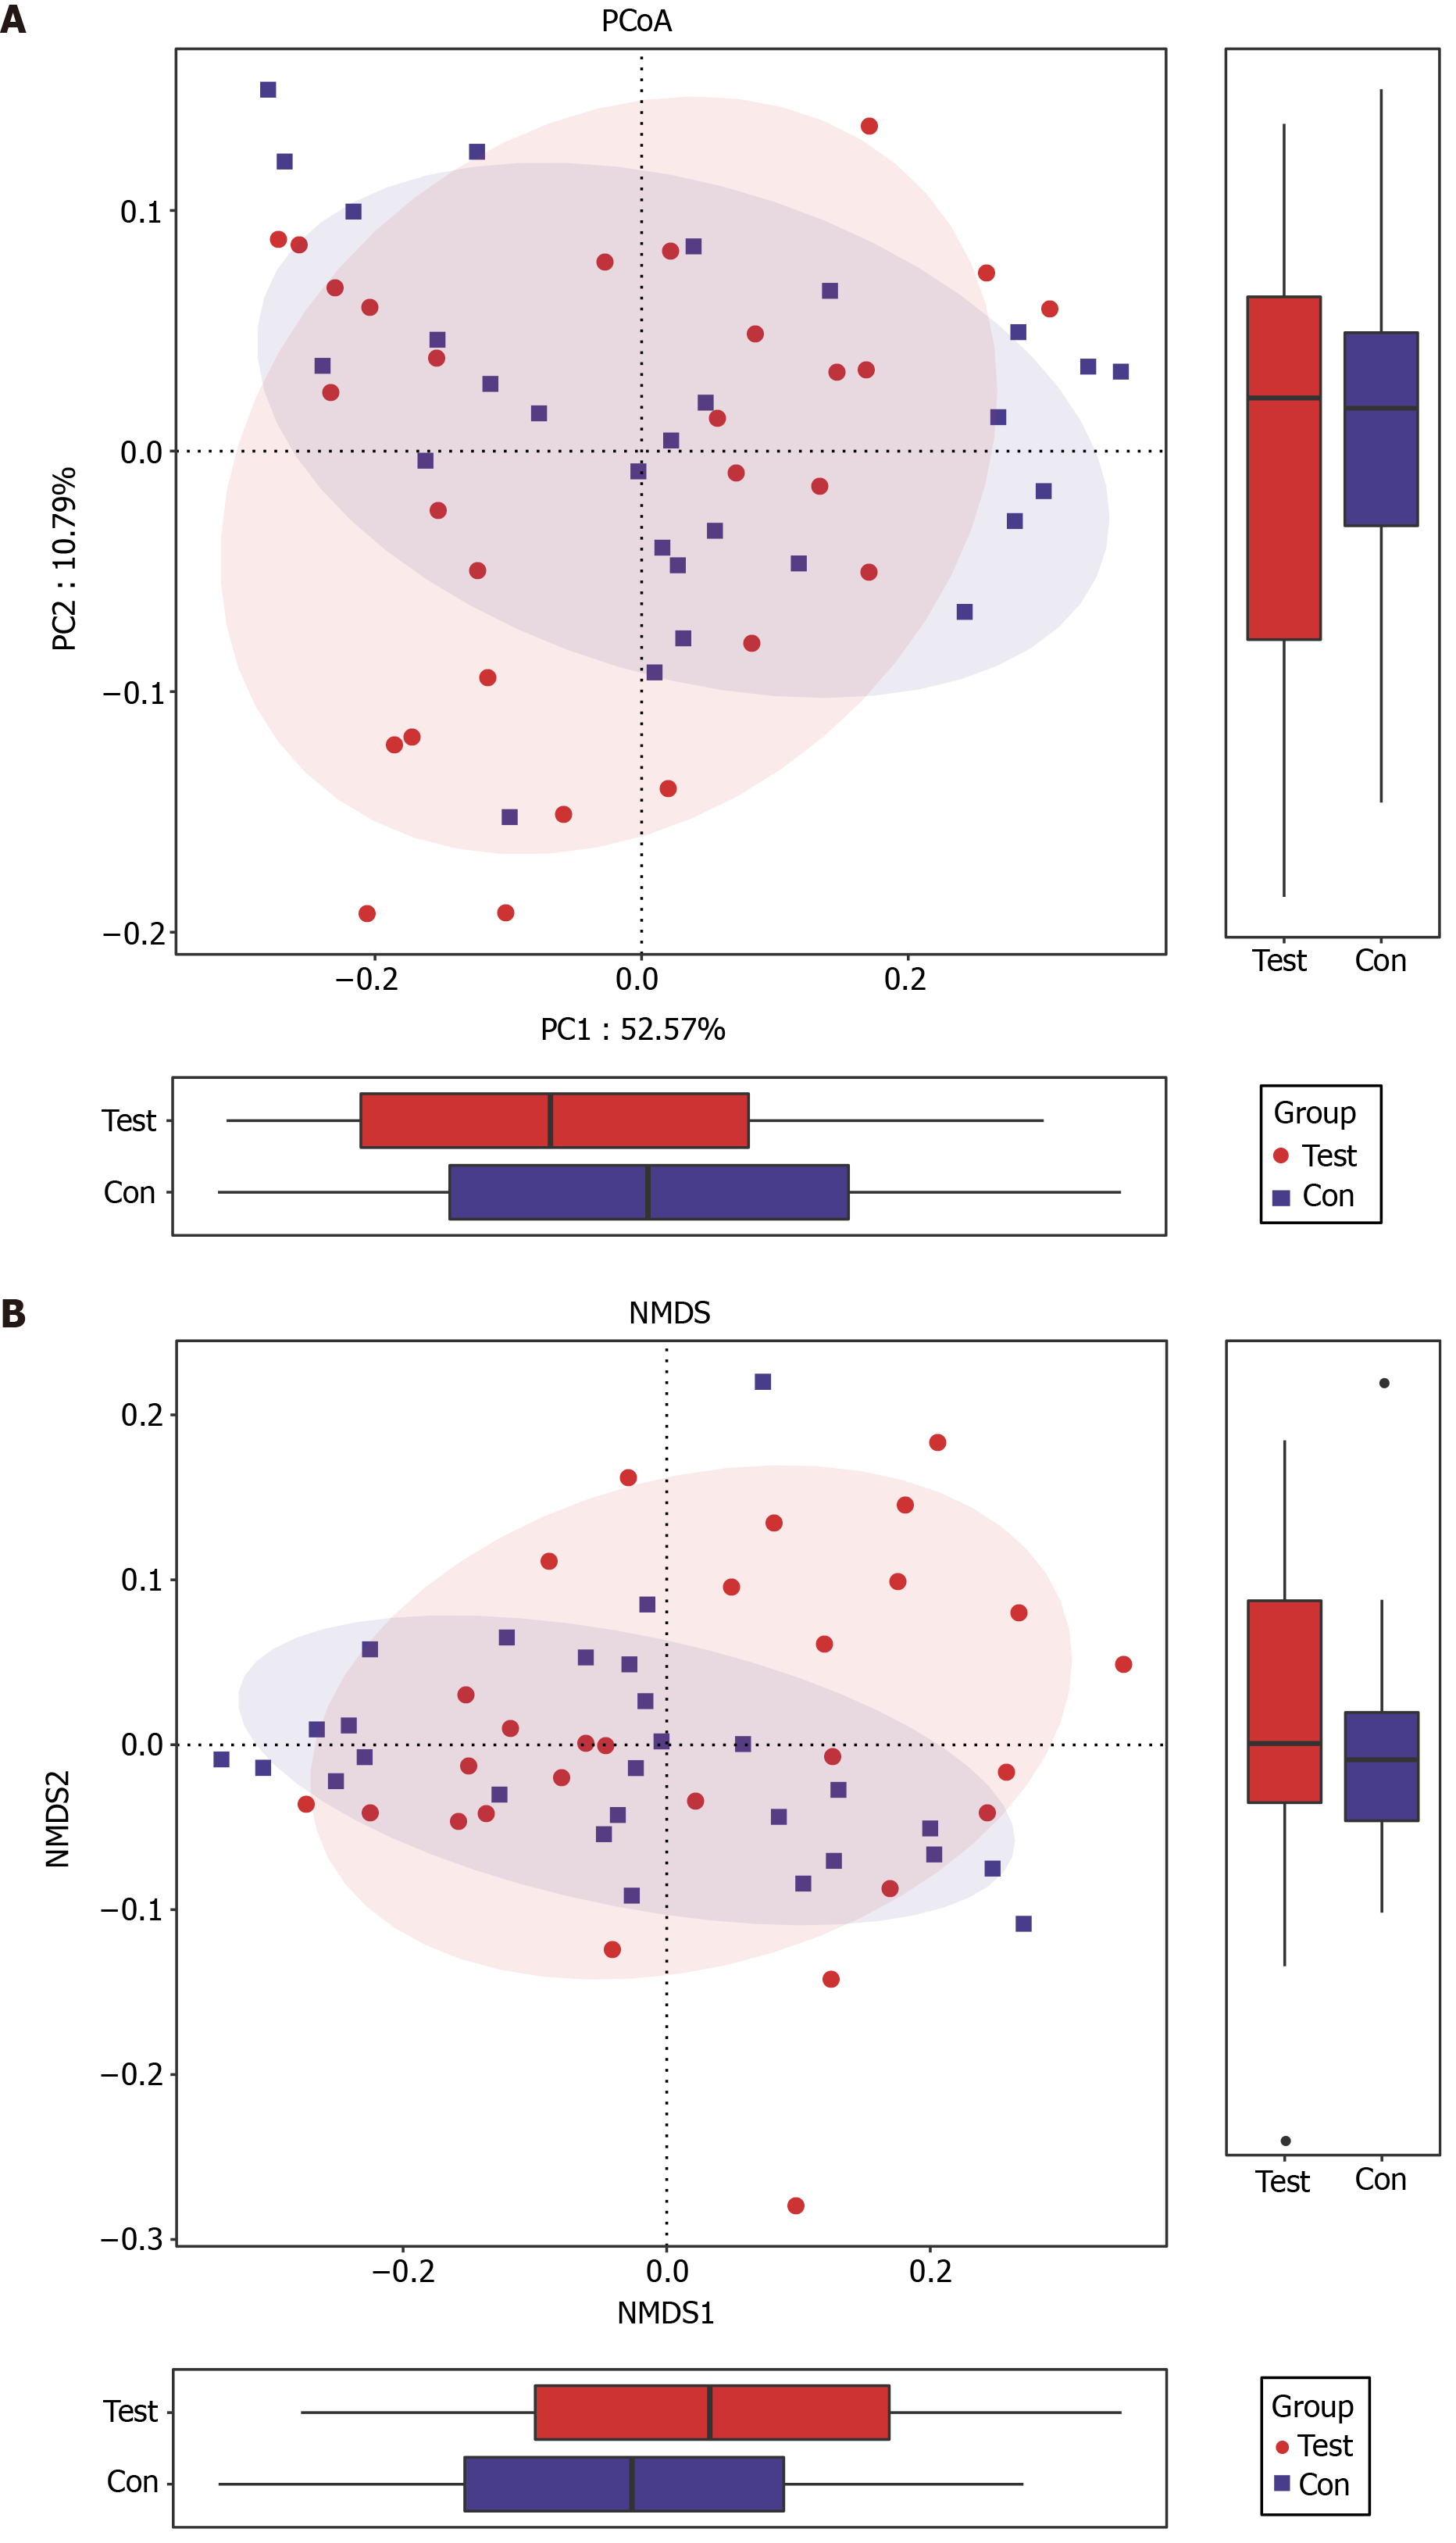
Figure 2 Examination of beta diversity using operational taxonomic units levels within the test and control groups.
A: Analysis of principal coordinates analysis plots using Weighted UniFrac distances; B: Analysis of nonmetric multidimensional scaling using Weighted UniFrac distances. One sample is represented by each symbol. PCoA: Principal coordinate analysis.
- Citation: Fan MY, Jiang QL, Cui MY, Zhao MQ, Wang JJ, Lu YY. Alteration of ascending colon mucosal microbiota in patients after cholecystectomy. World J Gastrointest Surg 2024; 16(8): 2436-2450
- URL: https://www.wjgnet.com/1948-9366/full/v16/i8/2436.htm
- DOI: https://dx.doi.org/10.4240/wjgs.v16.i8.2436


