Copyright
©The Author(s) 2024.
World J Gastrointest Surg. Jul 27, 2024; 16(7): 2194-2201
Published online Jul 27, 2024. doi: 10.4240/wjgs.v16.i7.2194
Published online Jul 27, 2024. doi: 10.4240/wjgs.v16.i7.2194
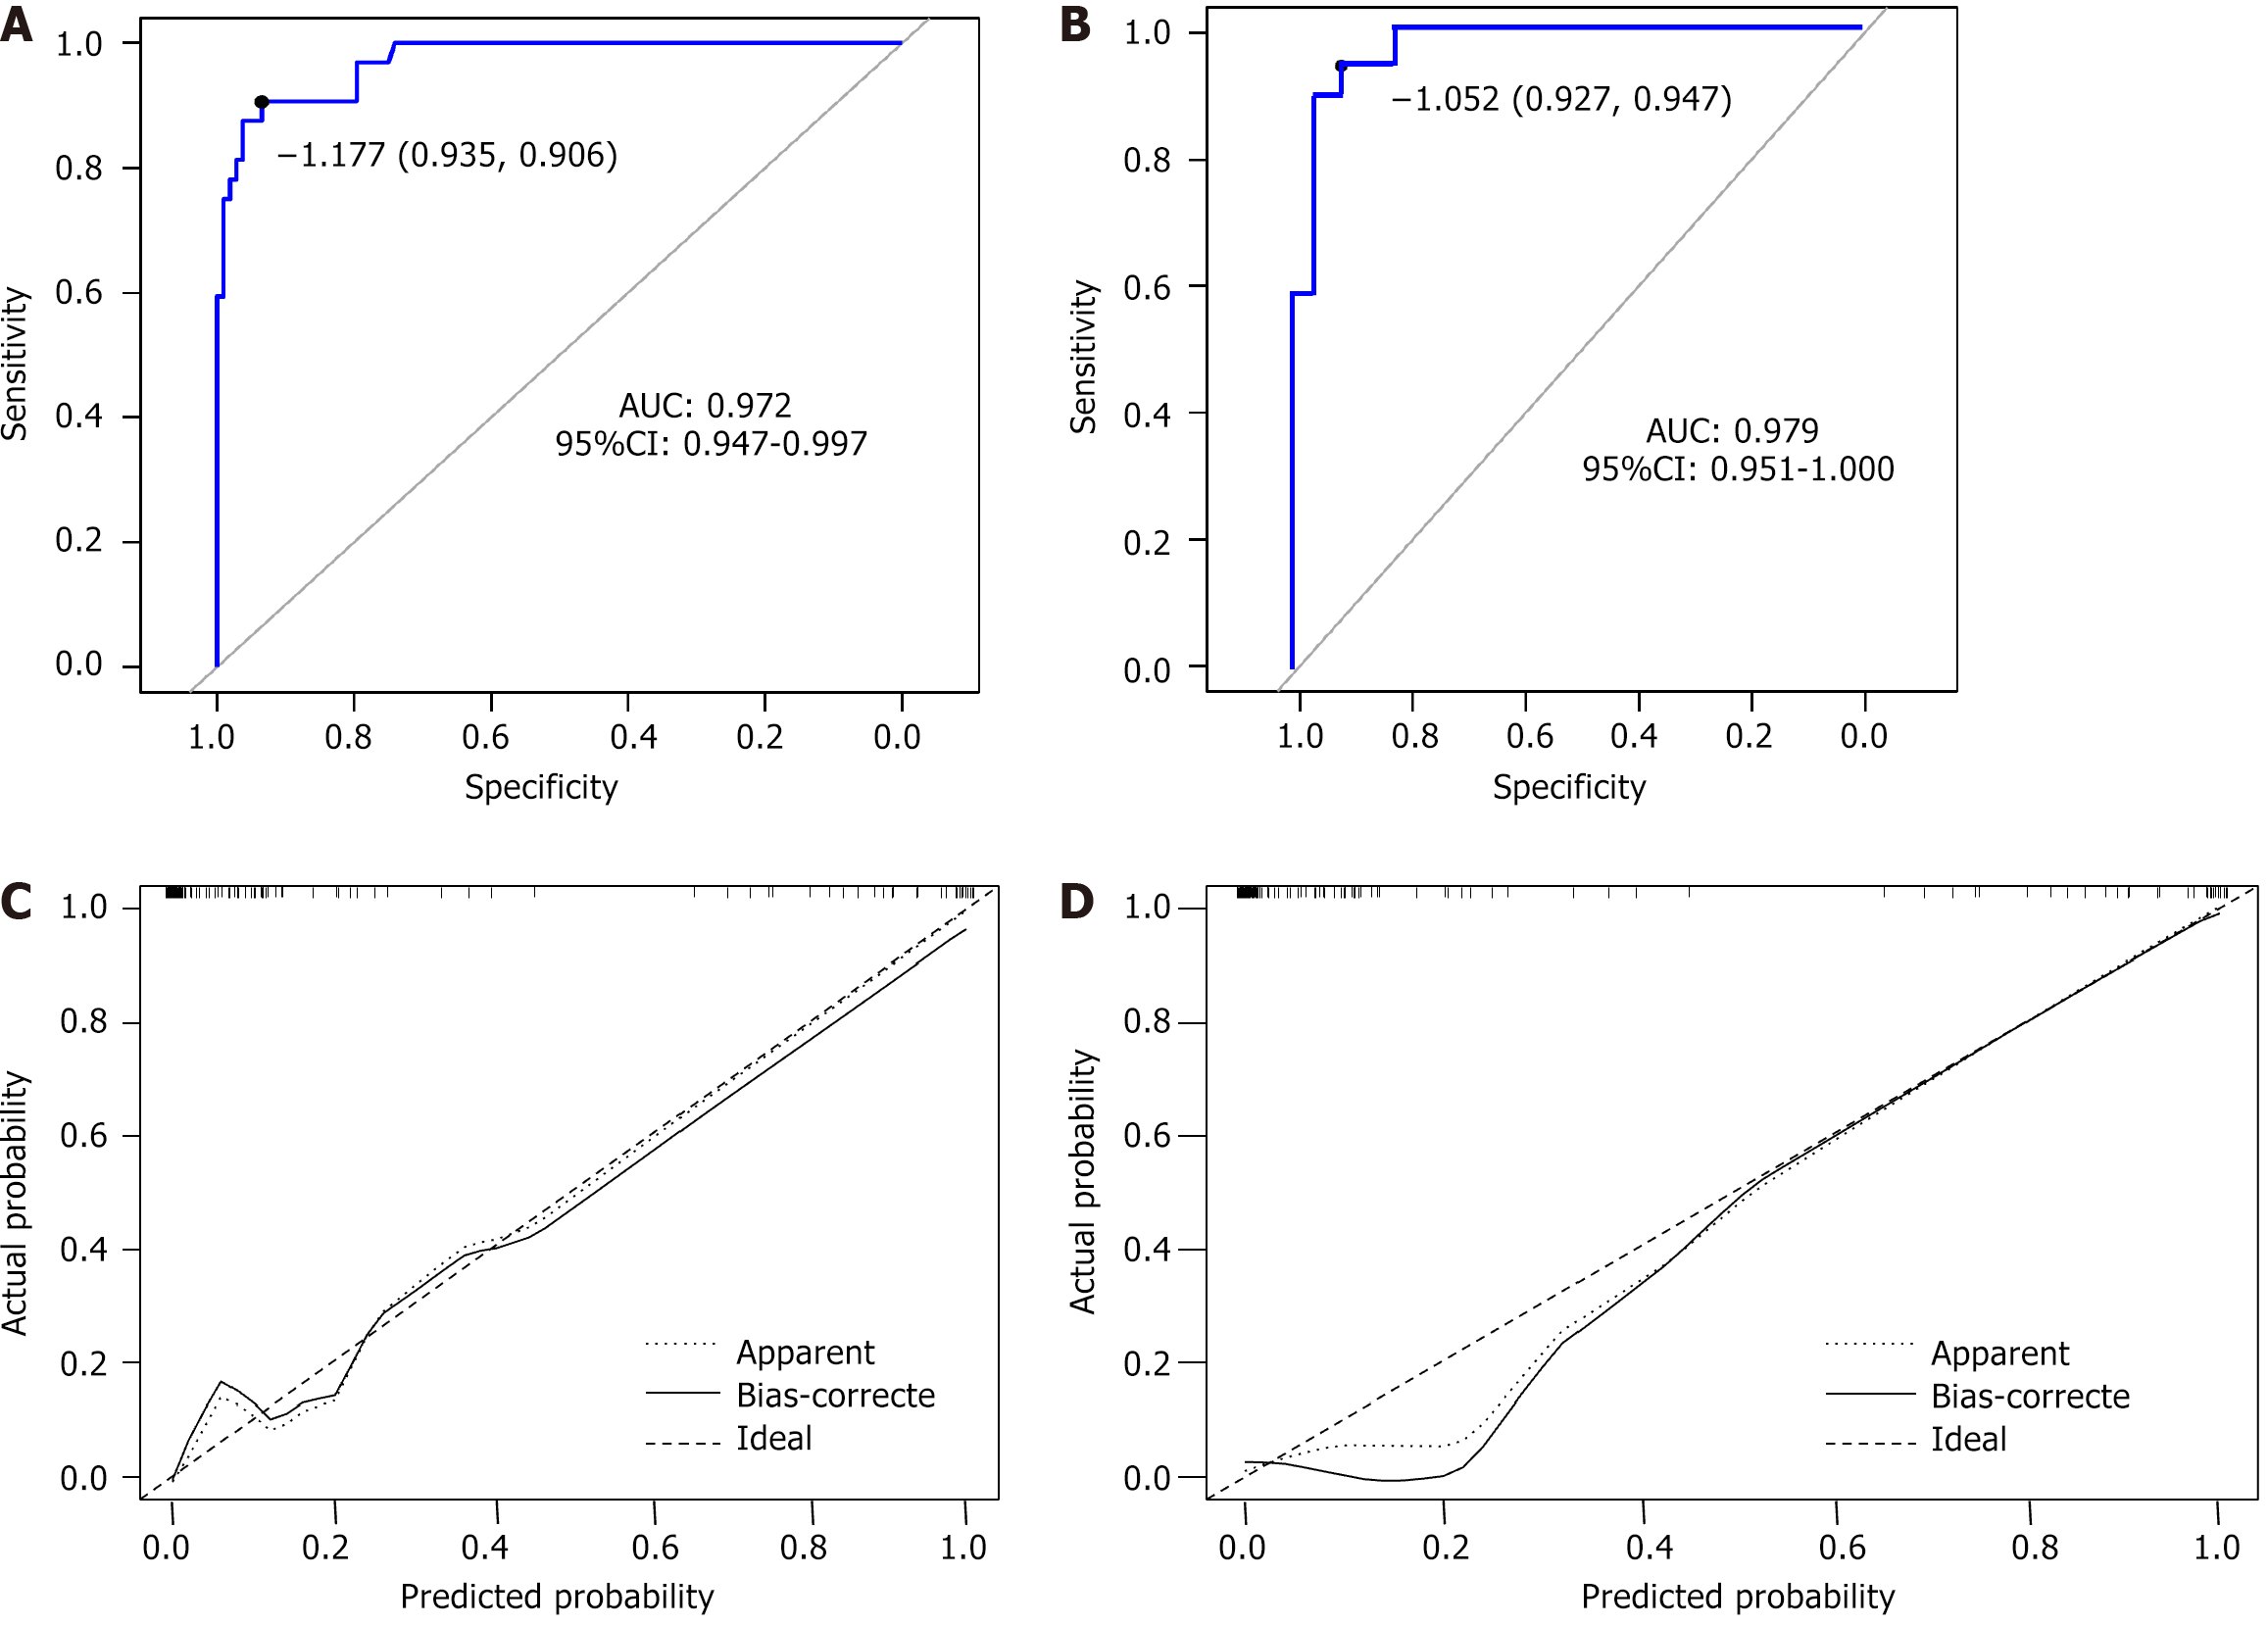
Figure 2 Receiver operating characteristic and calibration curve analysis.
A and B: It displays receiver operating characteristic curves plotted to further validate the predictive efficiency of the model. The curves represent both the training and test sets; C and D: The calibration curve illustrates the agreement between the predicted probability and the actual incidence of emergence agitation in both the training and test sets. A and C are training set, B and D are test set. AUC: Area under the curve.
- Citation: Song SS, Lin L, Li L, Han XD. Influencing factors and risk prediction model for emergence agitation after general anesthesia for primary liver cancer. World J Gastrointest Surg 2024; 16(7): 2194-2201
- URL: https://www.wjgnet.com/1948-9366/full/v16/i7/2194.htm
- DOI: https://dx.doi.org/10.4240/wjgs.v16.i7.2194


