Copyright
©The Author(s) 2024.
World J Gastrointest Surg. Jul 27, 2024; 16(7): 2145-2156
Published online Jul 27, 2024. doi: 10.4240/wjgs.v16.i7.2145
Published online Jul 27, 2024. doi: 10.4240/wjgs.v16.i7.2145
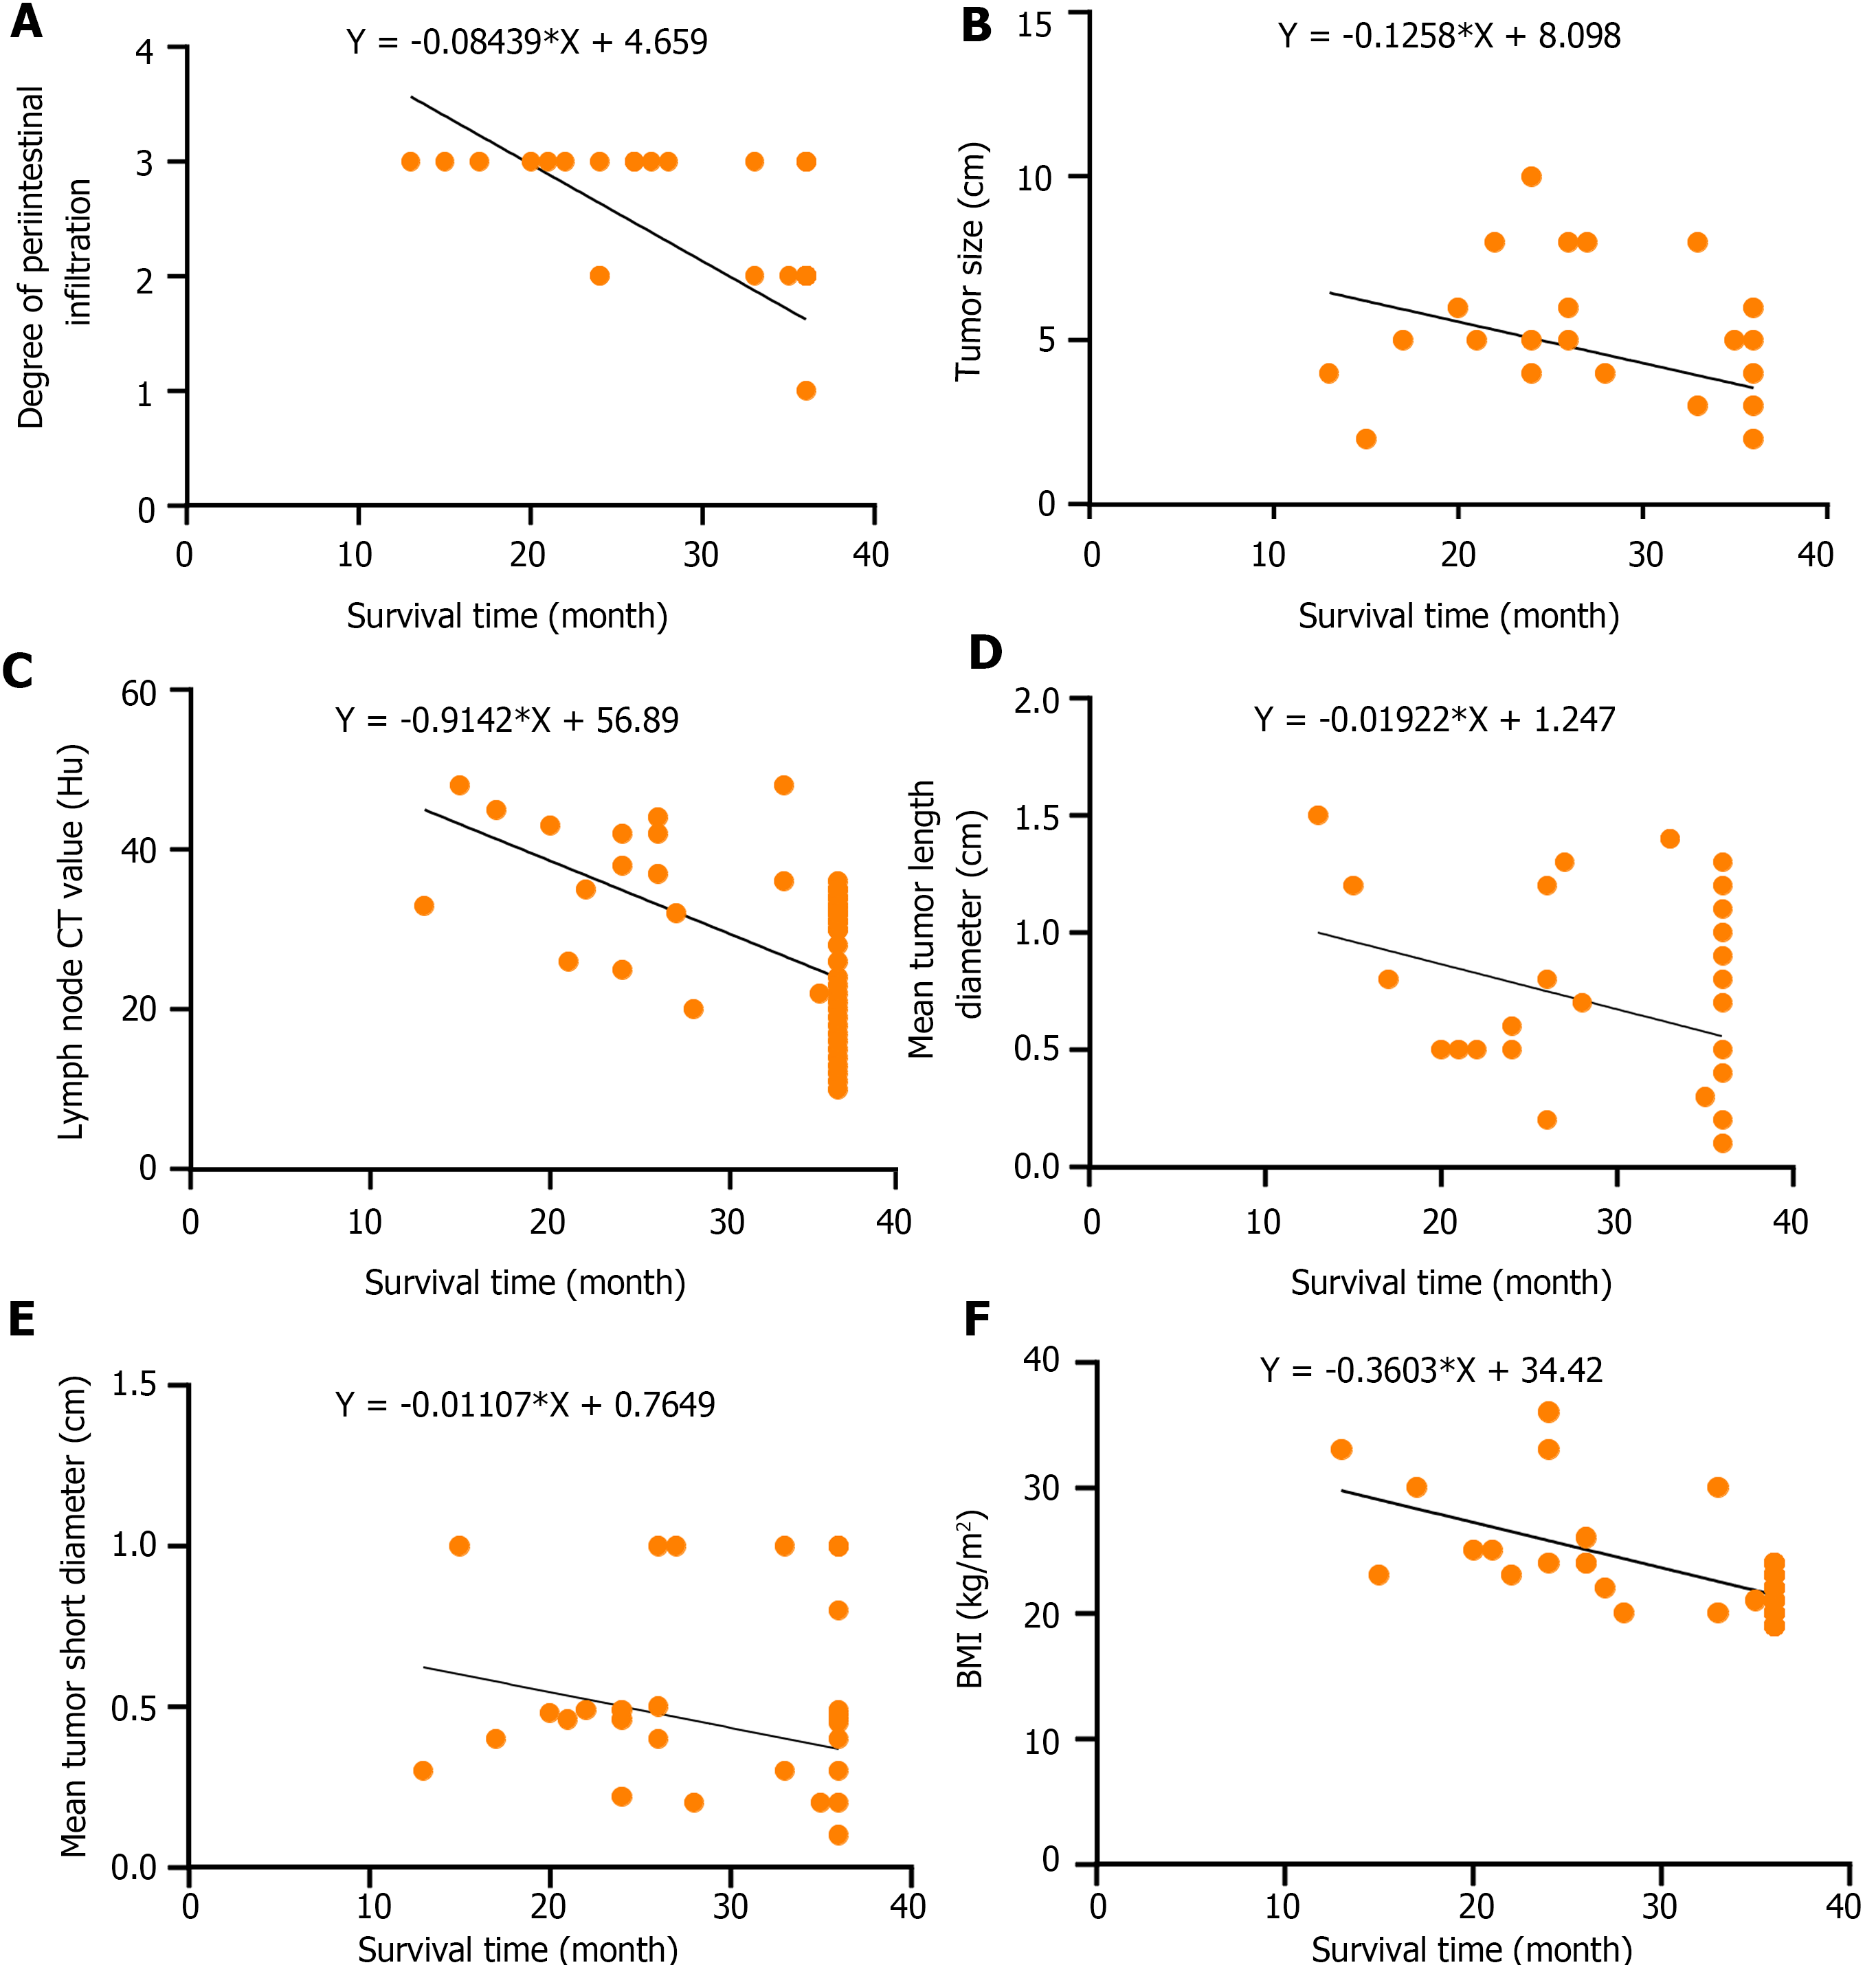
Figure 5 Scatter plot of correlation between postoperative survival time and abdominal computed tomography signs in patients with colorectal cancer.
A: Degree of periintestinal infiltration; B: Tumor size; C: Lymph node computed tomography value; D: Mean tumor long-axis diameter; E: Mean tumor short-axis diameter; F: Body mass index. BMI: Body mass index; CT: Computed tomography.
- Citation: Yang SM, Liu JM, Wen RP, Qian YD, He JB, Sun JS. Correlation between abdominal computed tomography signs and postoperative prognosis for patients with colorectal cancer. World J Gastrointest Surg 2024; 16(7): 2145-2156
- URL: https://www.wjgnet.com/1948-9366/full/v16/i7/2145.htm
- DOI: https://dx.doi.org/10.4240/wjgs.v16.i7.2145


