Copyright
©The Author(s) 2024.
World J Gastrointest Surg. Jul 27, 2024; 16(7): 2145-2156
Published online Jul 27, 2024. doi: 10.4240/wjgs.v16.i7.2145
Published online Jul 27, 2024. doi: 10.4240/wjgs.v16.i7.2145
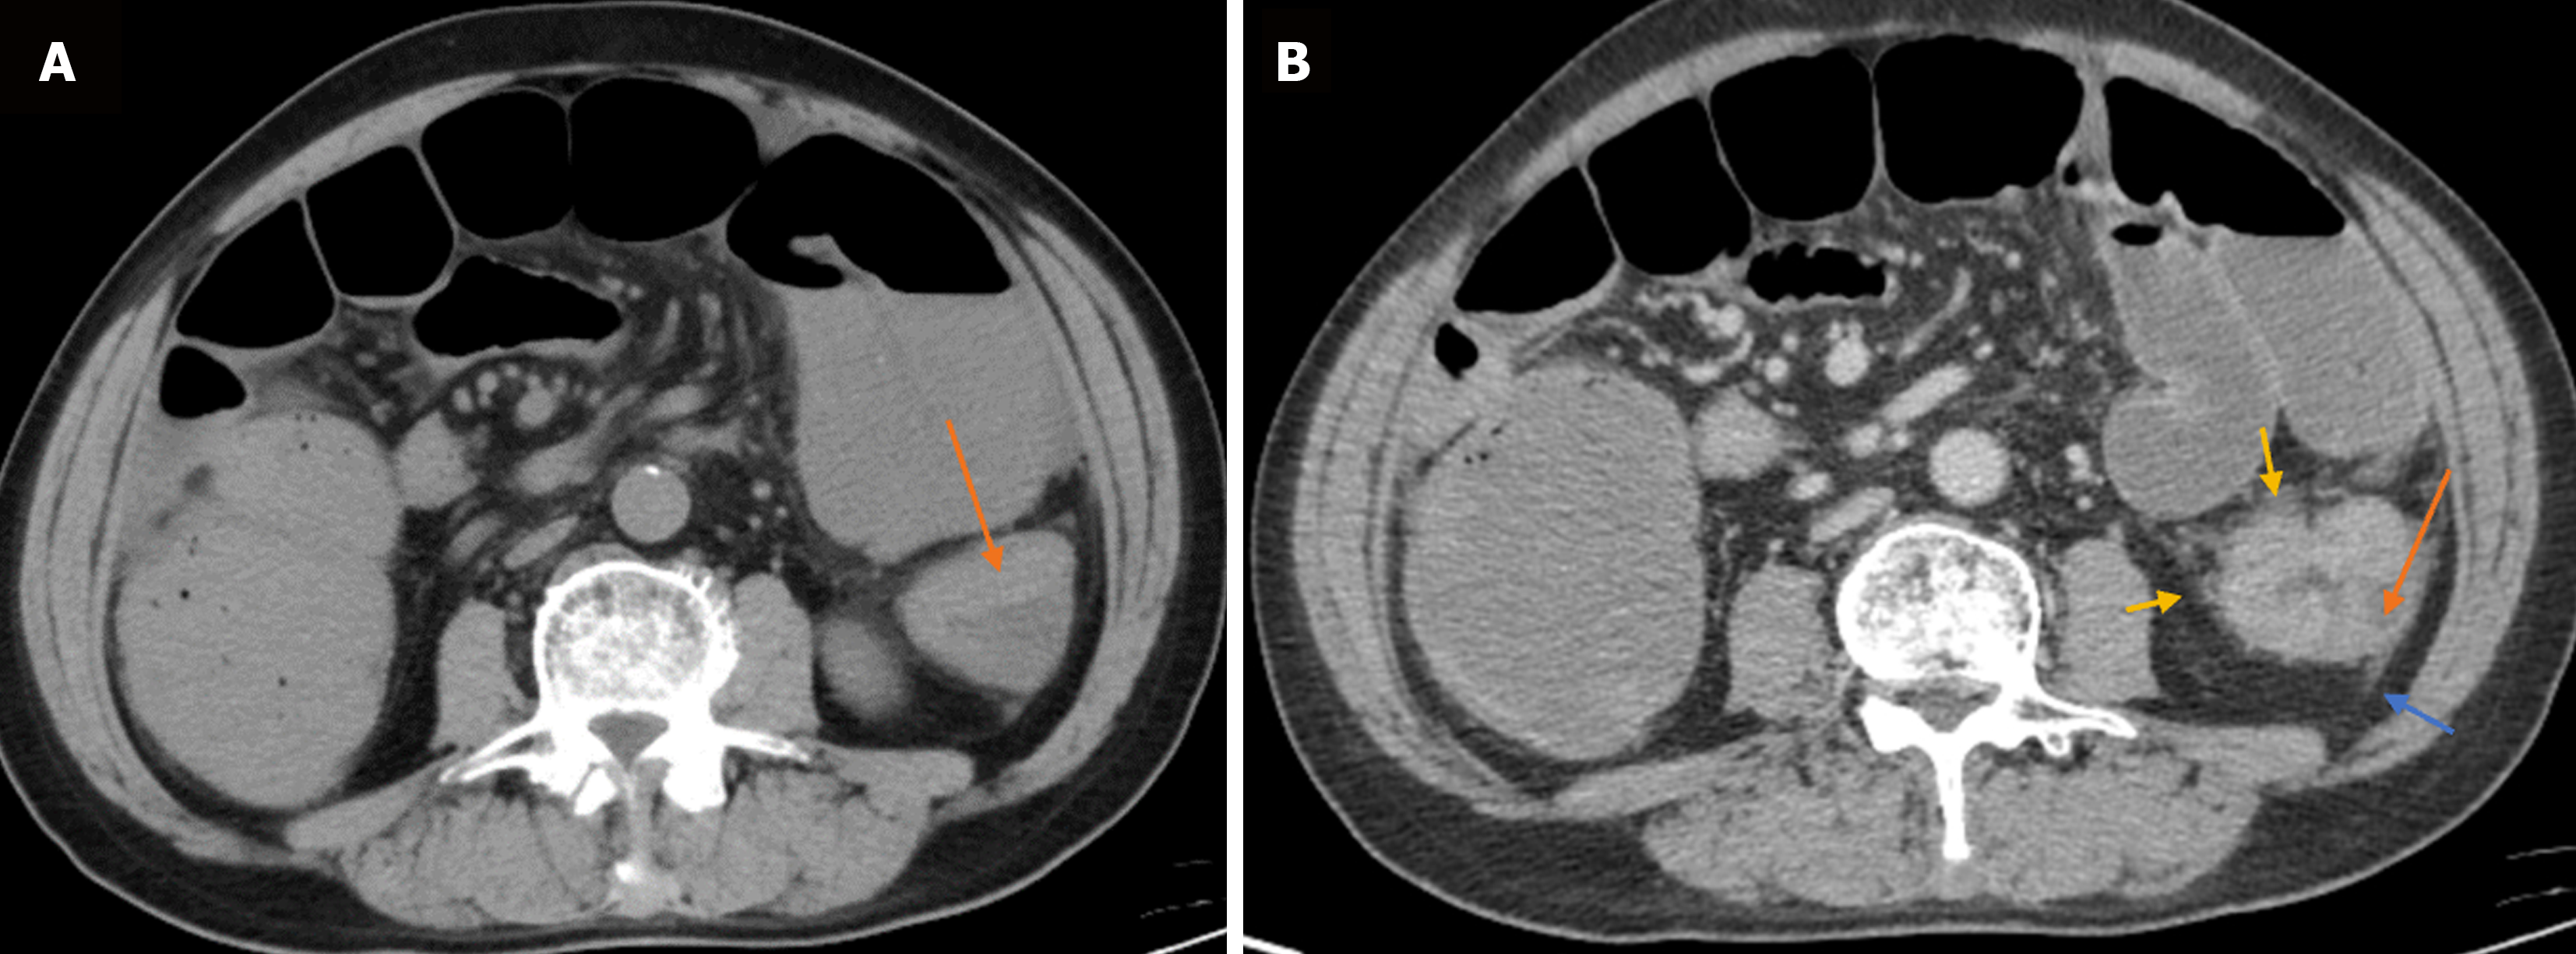
Figure 1 Computed tomography image of a 44-year-old male patient with colorectal cancer.
A: Plain computed tomography (CT) scan. The wall of the left descending colon (lower pole region of the flat kidney) was thickened circularly, and a soft tissue mass (indicated by the orange arrow) was observed. The density of the mass was similar to that of the muscle. The CT value was approximately 48 HU; B: Enhanced CT. The density of the mass was higher than that of the muscle, the CT value was approximately 68 HU, a weak enhancement area was seen in the mass (indicated by the orange arrow), the fat layer around the mass was blurred with enhancement (indicated by the yellow arrow), and the lateral vertebral fascia was thickened and enhanced (indicated by the blue arrow). The images also show that the patient’s proximal bowel duct was dilated.
- Citation: Yang SM, Liu JM, Wen RP, Qian YD, He JB, Sun JS. Correlation between abdominal computed tomography signs and postoperative prognosis for patients with colorectal cancer. World J Gastrointest Surg 2024; 16(7): 2145-2156
- URL: https://www.wjgnet.com/1948-9366/full/v16/i7/2145.htm
- DOI: https://dx.doi.org/10.4240/wjgs.v16.i7.2145


