Copyright
©The Author(s) 2024.
World J Gastrointest Surg. Jul 27, 2024; 16(7): 2054-2064
Published online Jul 27, 2024. doi: 10.4240/wjgs.v16.i7.2054
Published online Jul 27, 2024. doi: 10.4240/wjgs.v16.i7.2054
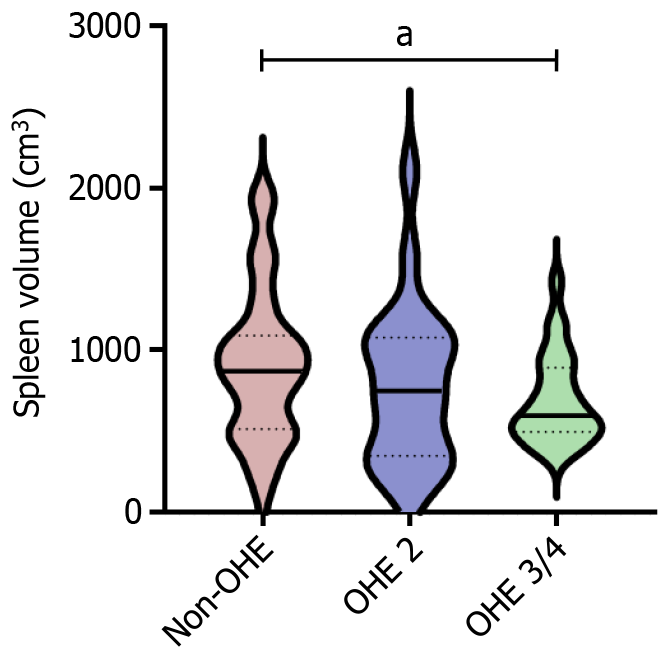
Figure 3 Comparison of spleen volumes among patients with different overt hepatic encephalopathy grades.
The patients were divided in three groups based on overt hepatic encephalopathy (OHE) grade: Non-OHE (n = 99), OHE 2 (n = 18), and OHE 3/4 (n = 19). Quantitative data are presented as median (interquartile range). Mann-Whitney U test, aP < 0.05. OHE: Overt hepatic encephalopathy.
- Citation: Zhao CJ, Ren C, Yuan Z, Bai GH, Li JY, Gao L, Li JH, Duan ZQ, Feng DP, Zhang H. Spleen volume is associated with overt hepatic encephalopathy after transjugular intrahepatic portosystemic shunt in patients with portal hypertension. World J Gastrointest Surg 2024; 16(7): 2054-2064
- URL: https://www.wjgnet.com/1948-9366/full/v16/i7/2054.htm
- DOI: https://dx.doi.org/10.4240/wjgs.v16.i7.2054


