Copyright
©The Author(s) 2024.
World J Gastrointest Surg. Jun 27, 2024; 16(6): 1918-1925
Published online Jun 27, 2024. doi: 10.4240/wjgs.v16.i6.1918
Published online Jun 27, 2024. doi: 10.4240/wjgs.v16.i6.1918
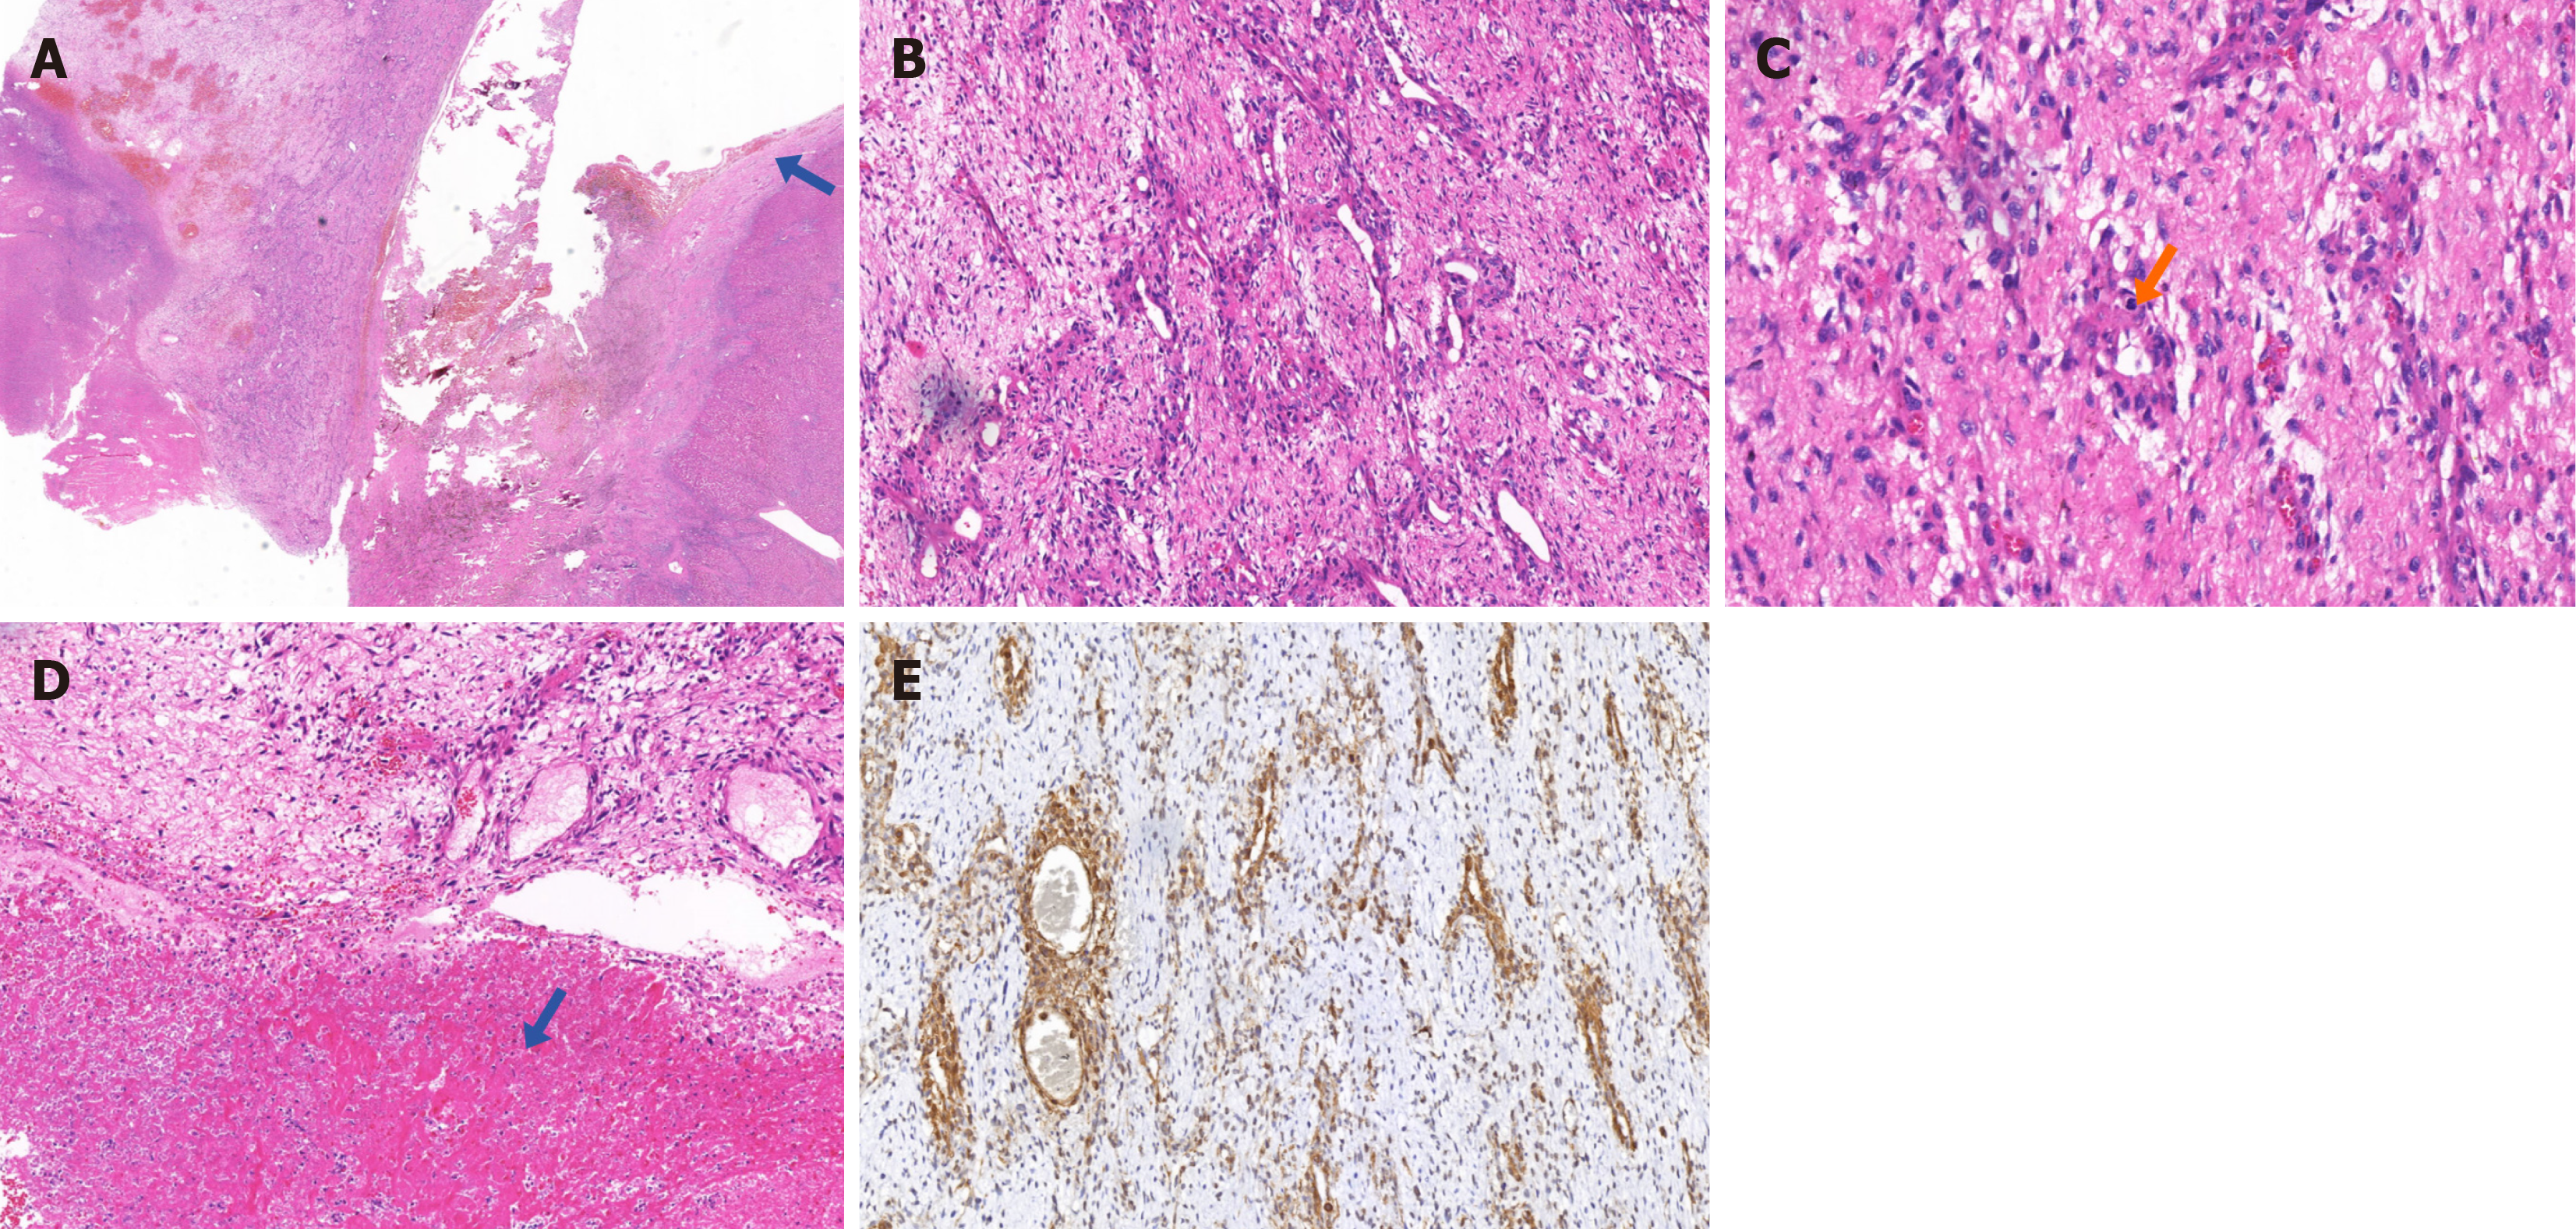
Figure 2 Immunostaining results of the first surgery.
A: The left half is tumor tissue and the right half is normal liver tissue. The tumor cells did not significantly invade the normal liver tissue. The arrow indicates a thickened but intact liver capsule (magnification power: 10 ×); B: Tumor cells in a concentric pattern around the blood vessels (magnification power: 100 ×); C: Abnormal mitotic figures appearing in the tumor cells (magnification power: 200 ×); D: Areas of necrosis within the tumor (magnification power: 100 ×); E: Diffuse smooth muscle actin expression in tumor cells (magnification power: 100 ×).
- Citation: Zhang HL, Zhang M, Guo JQ, Wu FN, Zhu JD, Tu CY, Lv XL, Zhang K. Malignant myopericytoma originating from the colon: A case report. World J Gastrointest Surg 2024; 16(6): 1918-1925
- URL: https://www.wjgnet.com/1948-9366/full/v16/i6/1918.htm
- DOI: https://dx.doi.org/10.4240/wjgs.v16.i6.1918


