Copyright
©The Author(s) 2024.
World J Gastrointest Surg. Jun 27, 2024; 16(6): 1894-1909
Published online Jun 27, 2024. doi: 10.4240/wjgs.v16.i6.1894
Published online Jun 27, 2024. doi: 10.4240/wjgs.v16.i6.1894
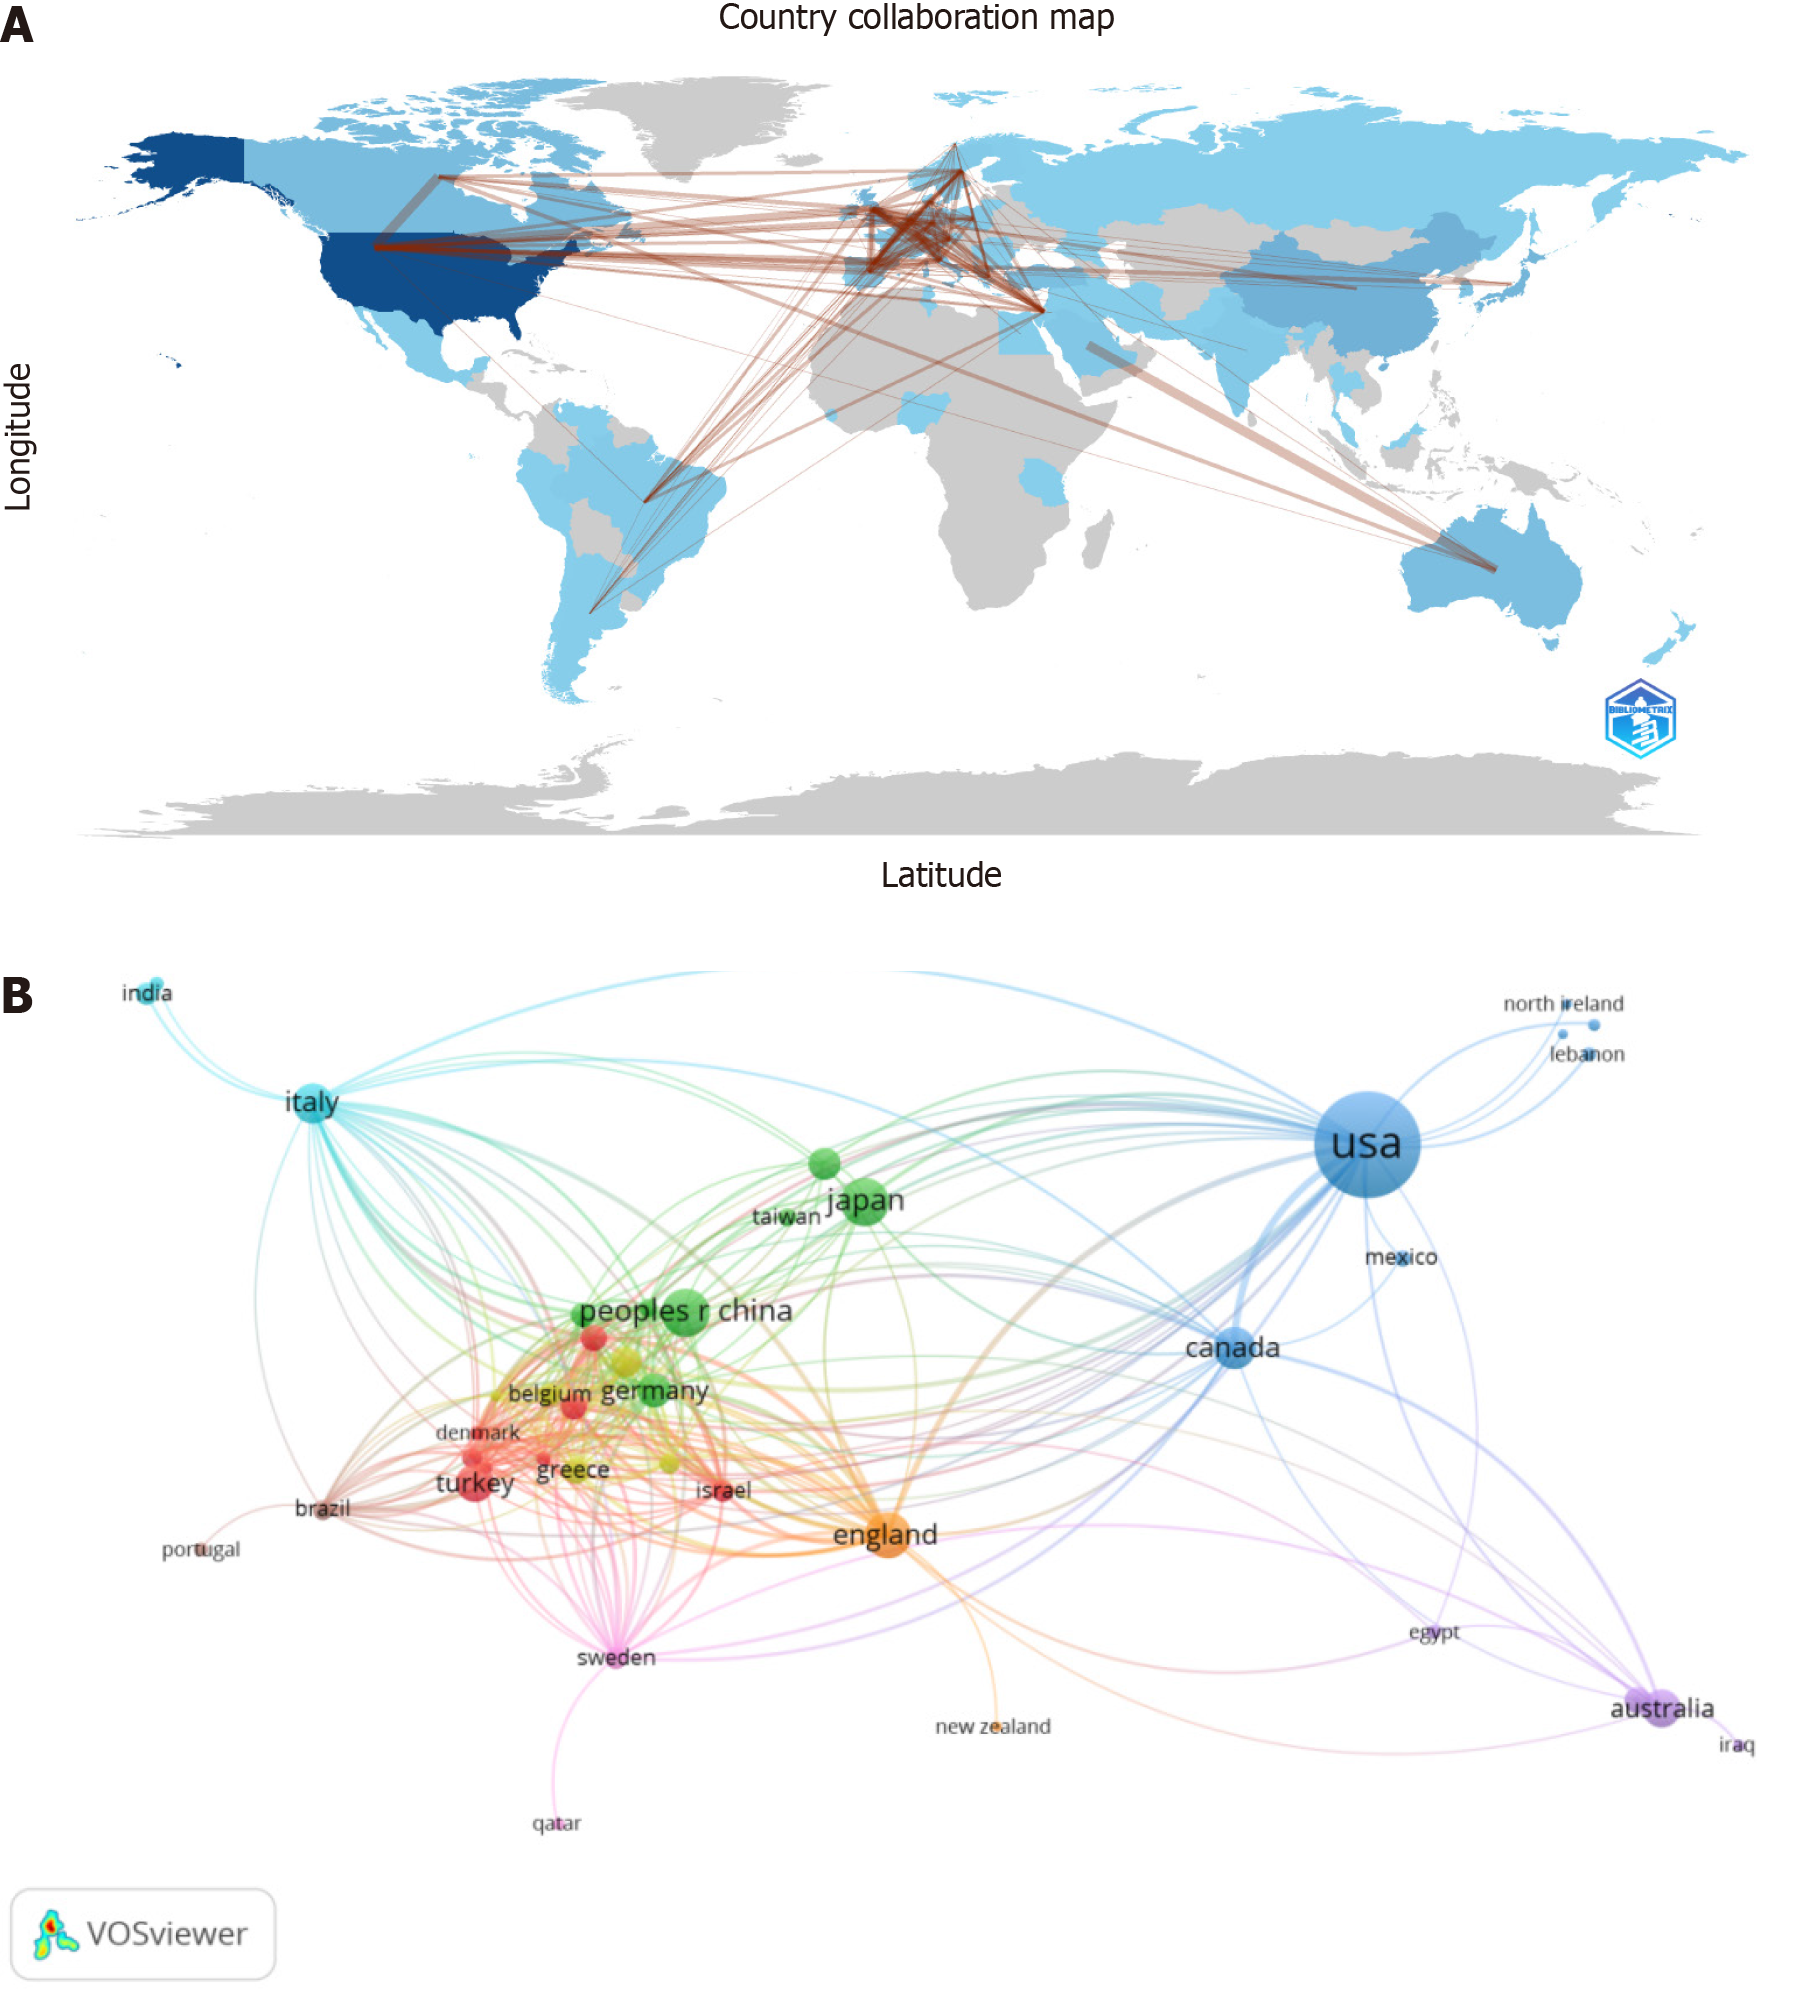
Figure 4 Geographical distribution and visualization of countries/regions.
A: Intensity of the blue color represents publication count and thickness of the line represents cooperation intensity; B: Node size represents publication count, and link size indicates cooperation intensity.
- Citation: Ji JN, Yin ZB. Visualizing the landscape of appendiceal tumor research after 2010: A bibliometric study. World J Gastrointest Surg 2024; 16(6): 1894-1909
- URL: https://www.wjgnet.com/1948-9366/full/v16/i6/1894.htm
- DOI: https://dx.doi.org/10.4240/wjgs.v16.i6.1894


