Copyright
©The Author(s) 2024.
World J Gastrointest Surg. Jun 27, 2024; 16(6): 1803-1824
Published online Jun 27, 2024. doi: 10.4240/wjgs.v16.i6.1803
Published online Jun 27, 2024. doi: 10.4240/wjgs.v16.i6.1803
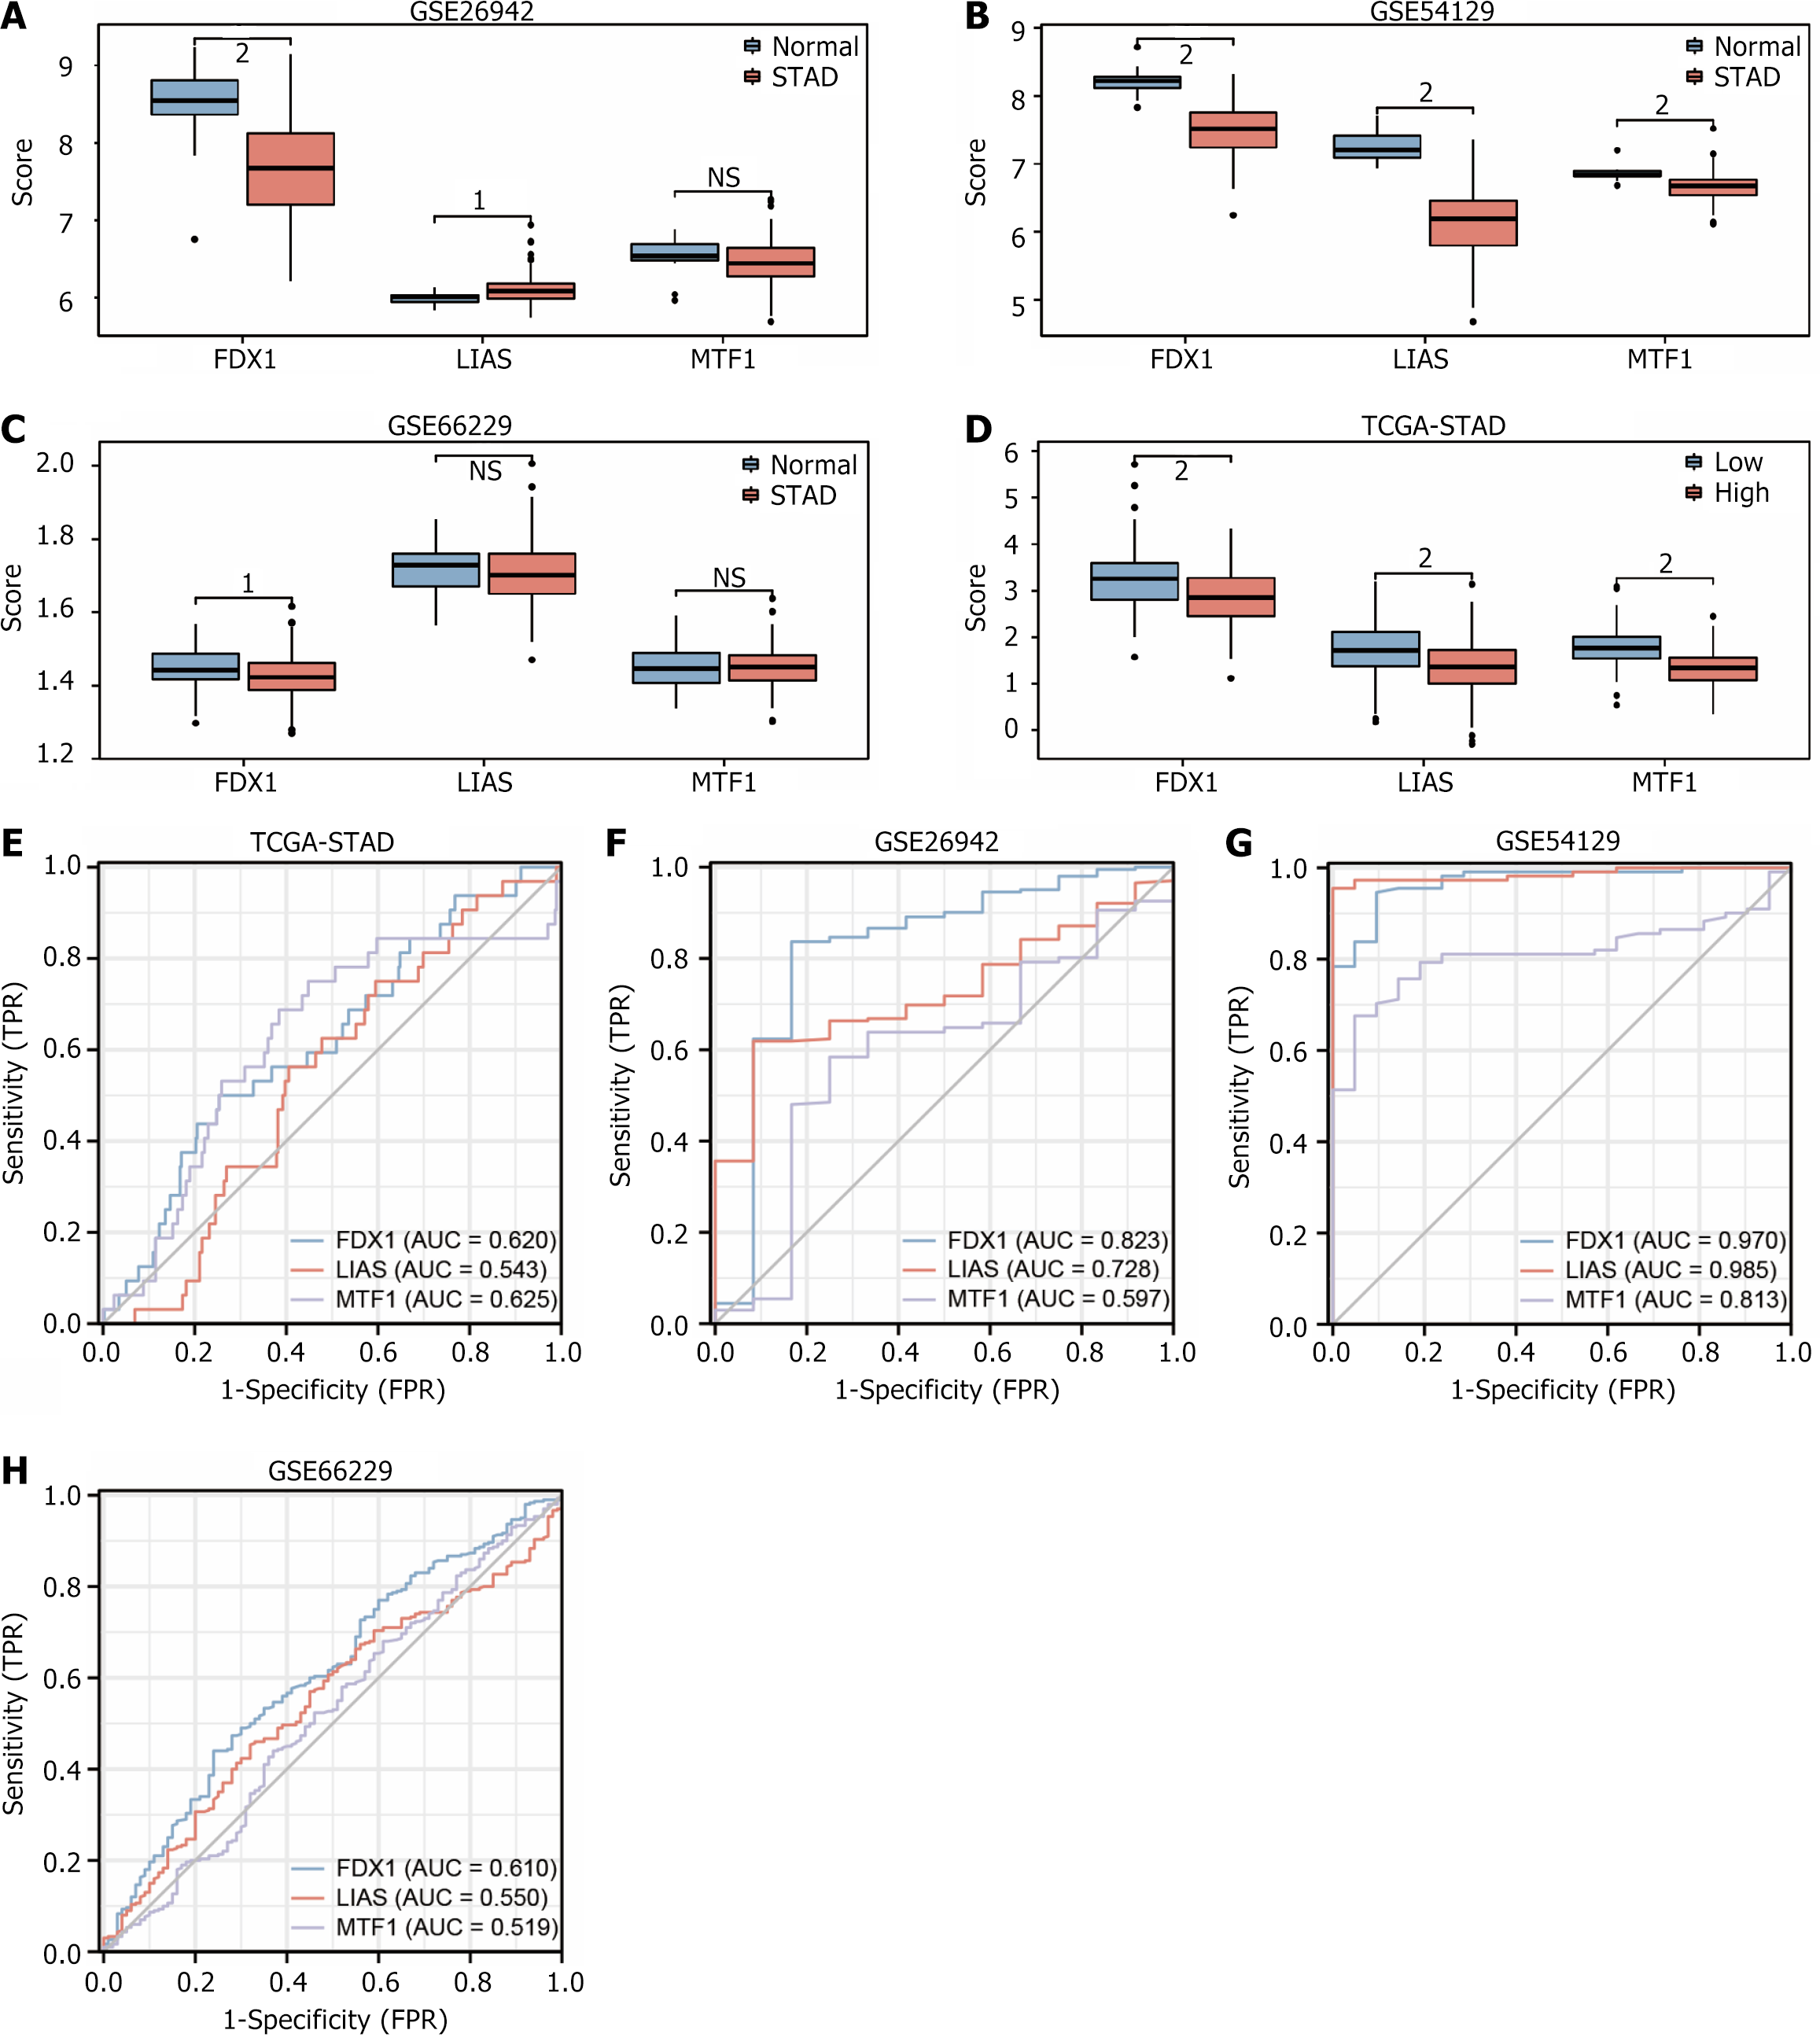
Figure 10 Expression and receiver operating characteristic curve validation of the The Gene Expression Omnibus dataset for prognosis-related differentially expressed genes.
A: Expression validation plot of gene FDX1, LIAS, MTF1 in data set GSE26942; B: Expression validation plot of gene FDX1, LIAS, MTF1 in data set GSE54129; C: Expression validation plot of gene FDX1, LIAS, MTF1 in data set GSE66229; D: Expression validation plot of gene FDX1, LIAS, MTF1 in data set The Cancer Genome Atlas (TCGA)-stomach adenocarcinoma (STAD). MTF1 expression validation plot in dataset TCGA-STAD; E: Receiver operating characteristic curves (ROCs) for gene FDX1, LIAS, MTF1 in dataset GSE26942; F: ROC validation of gene FDX1, LIAS, MTF1 in dataset GSE54129; G: ROC curves for gene FDX1, LIAS, MTF1 in dataset ROC validation in dataset GSE66229; H: ROC validation of gene FDX1, LIAS, MTF1 in dataset TCGA-STAD; I: ROC validation of gene FDX1, LIAS, MTF1 in dataset TCGA-STAD. Up: Up-regulated genes; Down: Down-regulated genes; AUC: Aera under the curve. 1P < 0.01, which is highly statistically significant. 2P < 0.001 and highly statistically significant.
- Citation: Xie XZ, Zuo L, Huang W, Fan QM, Weng YY, Yao WD, Jiang JL, Jin JQ. FDX1 as a novel biomarker and treatment target for stomach adenocarcinoma. World J Gastrointest Surg 2024; 16(6): 1803-1824
- URL: https://www.wjgnet.com/1948-9366/full/v16/i6/1803.htm
- DOI: https://dx.doi.org/10.4240/wjgs.v16.i6.1803


