Copyright
©The Author(s) 2024.
World J Gastrointest Surg. Jun 27, 2024; 16(6): 1803-1824
Published online Jun 27, 2024. doi: 10.4240/wjgs.v16.i6.1803
Published online Jun 27, 2024. doi: 10.4240/wjgs.v16.i6.1803
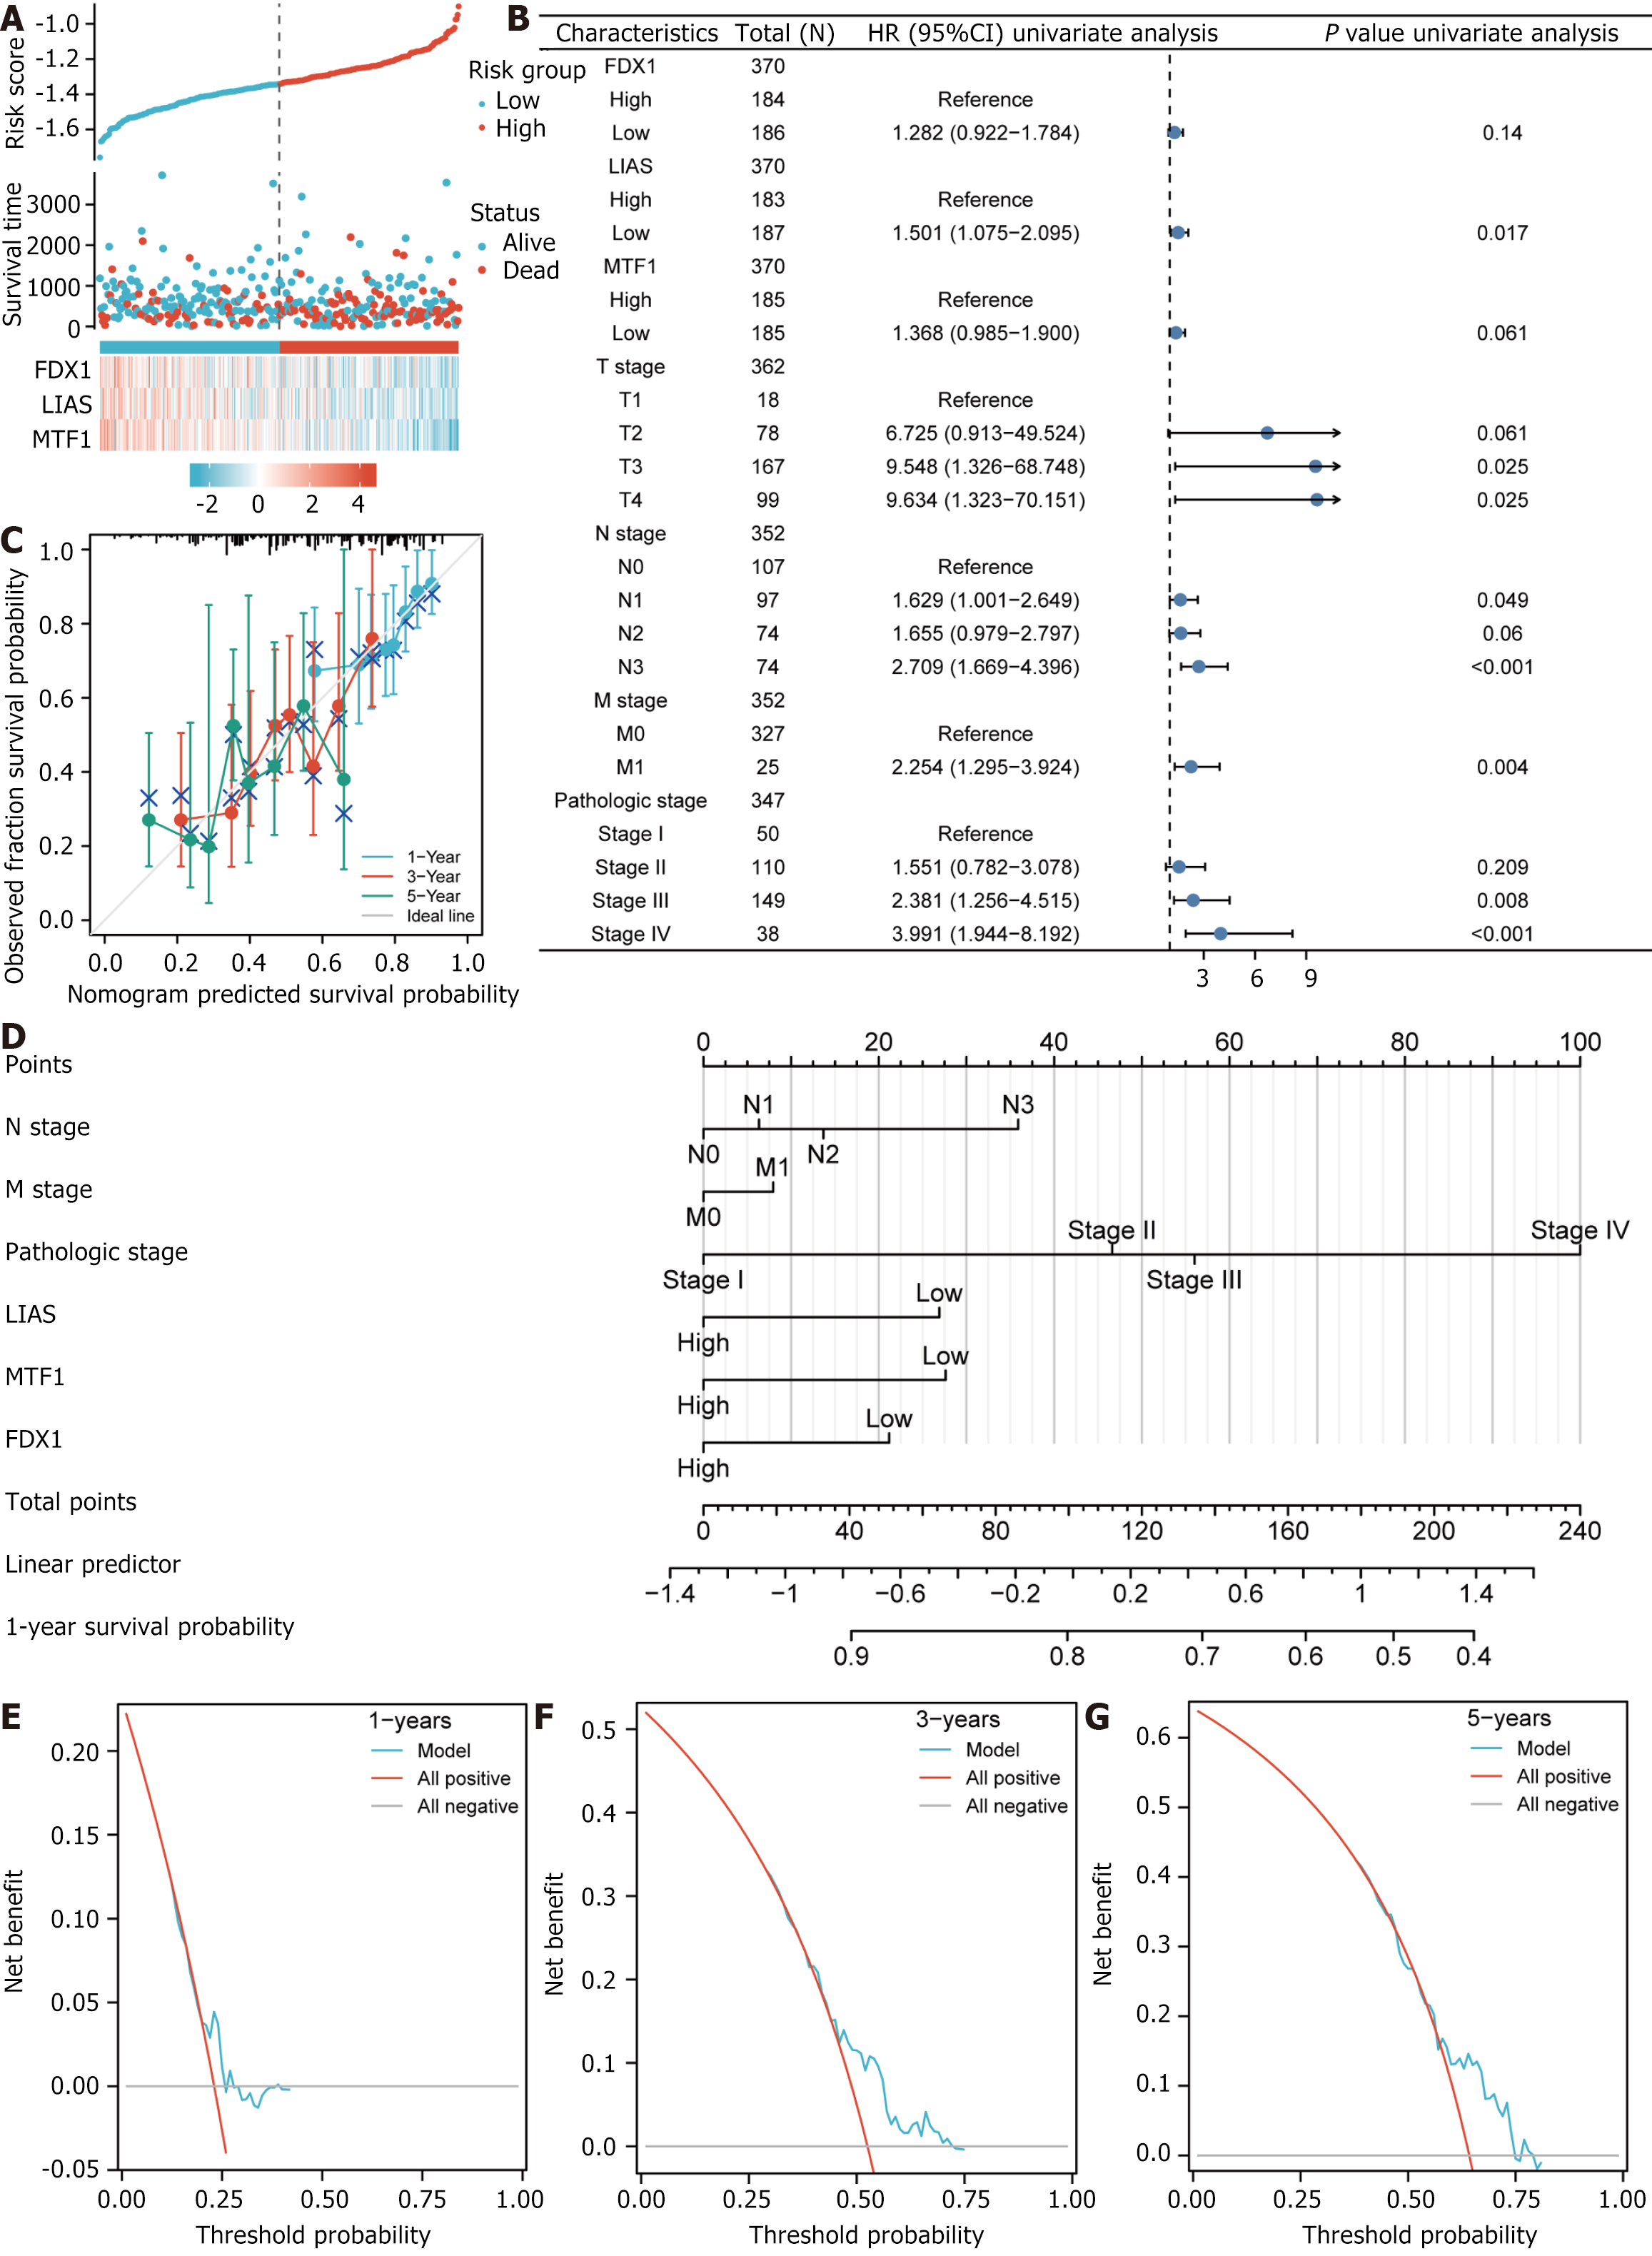
Figure 9 Prognostic analysis and performance of predictive differentially expressed genes.
A: Risk factor plot; B: Forest plot for univaiate Cox regression analysis of differentially expressed genes for copper death prognosis; C: 1-, 3- and 5-year calibration curve plots; D: Nomogram; E: 1-year decision curve analysis (DCA) plot for Least Absolute Shrinkage and Selection Operator (LASSO) regression prognosis model; F: 3-year DCA plot for LASSO regression prognosis model; G: 5-year DCA plot for LASSO regression prognosis model.
- Citation: Xie XZ, Zuo L, Huang W, Fan QM, Weng YY, Yao WD, Jiang JL, Jin JQ. FDX1 as a novel biomarker and treatment target for stomach adenocarcinoma. World J Gastrointest Surg 2024; 16(6): 1803-1824
- URL: https://www.wjgnet.com/1948-9366/full/v16/i6/1803.htm
- DOI: https://dx.doi.org/10.4240/wjgs.v16.i6.1803


