Copyright
©The Author(s) 2024.
World J Gastrointest Surg. Jun 27, 2024; 16(6): 1803-1824
Published online Jun 27, 2024. doi: 10.4240/wjgs.v16.i6.1803
Published online Jun 27, 2024. doi: 10.4240/wjgs.v16.i6.1803
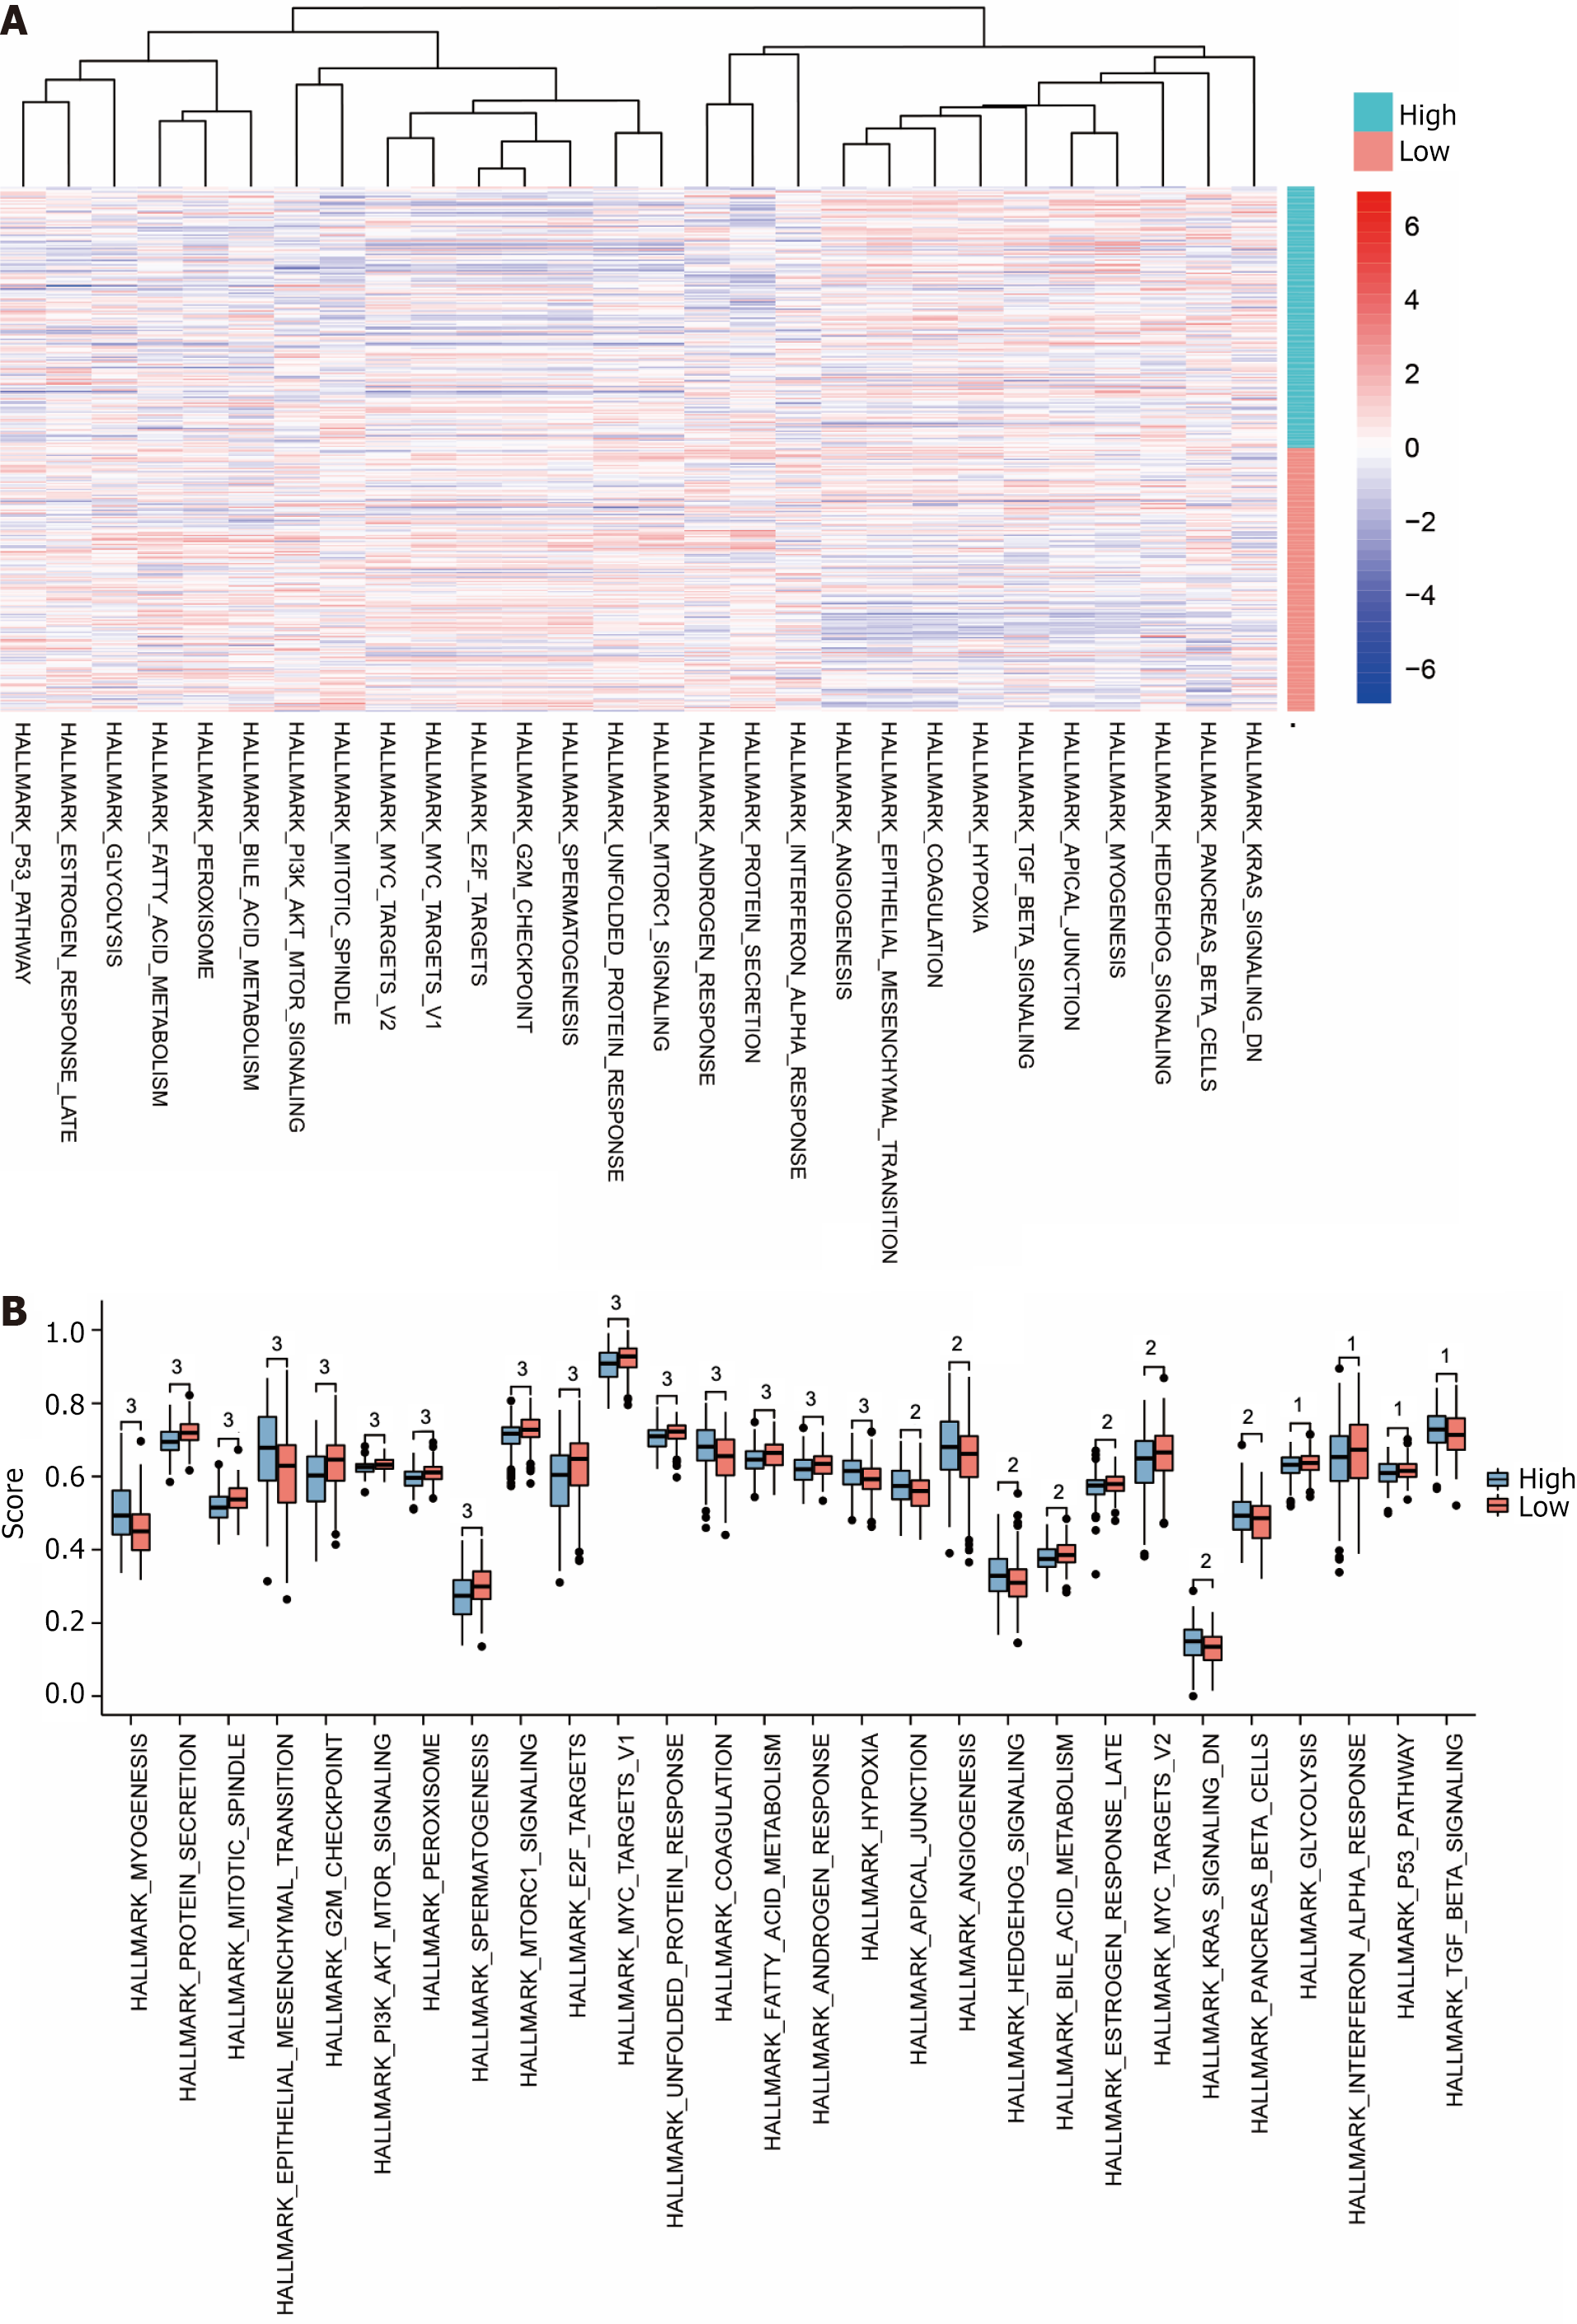
Figure 7 Visualisation of Gene Set Variation Analysis results.
A: Complex heat map of gene sets showing differences (P < 0.05) between datasets The Cancer Genome Atlas (TCGA)-stomach adenocarcinoma (STAD) high and low risk subgroups (subgroup: High and subgroup: Low); B: Subgroup comparison map of gene sets showing differences (P < 0.05) between datasets TCGA-STAD high and low risk subgroups (subgroup: High and subgroup: Low); C: Comparison of gene sets showing differences (P < 0.05) between datasets TCGA-STAD high and low risk subgroups (subgroup: High and subgroup: Low). Up: Up-regulated genes; Down: Down-regulated genes. 1P < 0.05, indicating statistical significance. 2P < 0.01, which is highly statistically significant. 3P < 0.001 and highly statistically significant.
- Citation: Xie XZ, Zuo L, Huang W, Fan QM, Weng YY, Yao WD, Jiang JL, Jin JQ. FDX1 as a novel biomarker and treatment target for stomach adenocarcinoma. World J Gastrointest Surg 2024; 16(6): 1803-1824
- URL: https://www.wjgnet.com/1948-9366/full/v16/i6/1803.htm
- DOI: https://dx.doi.org/10.4240/wjgs.v16.i6.1803


