Copyright
©The Author(s) 2024.
World J Gastrointest Surg. Jun 27, 2024; 16(6): 1803-1824
Published online Jun 27, 2024. doi: 10.4240/wjgs.v16.i6.1803
Published online Jun 27, 2024. doi: 10.4240/wjgs.v16.i6.1803
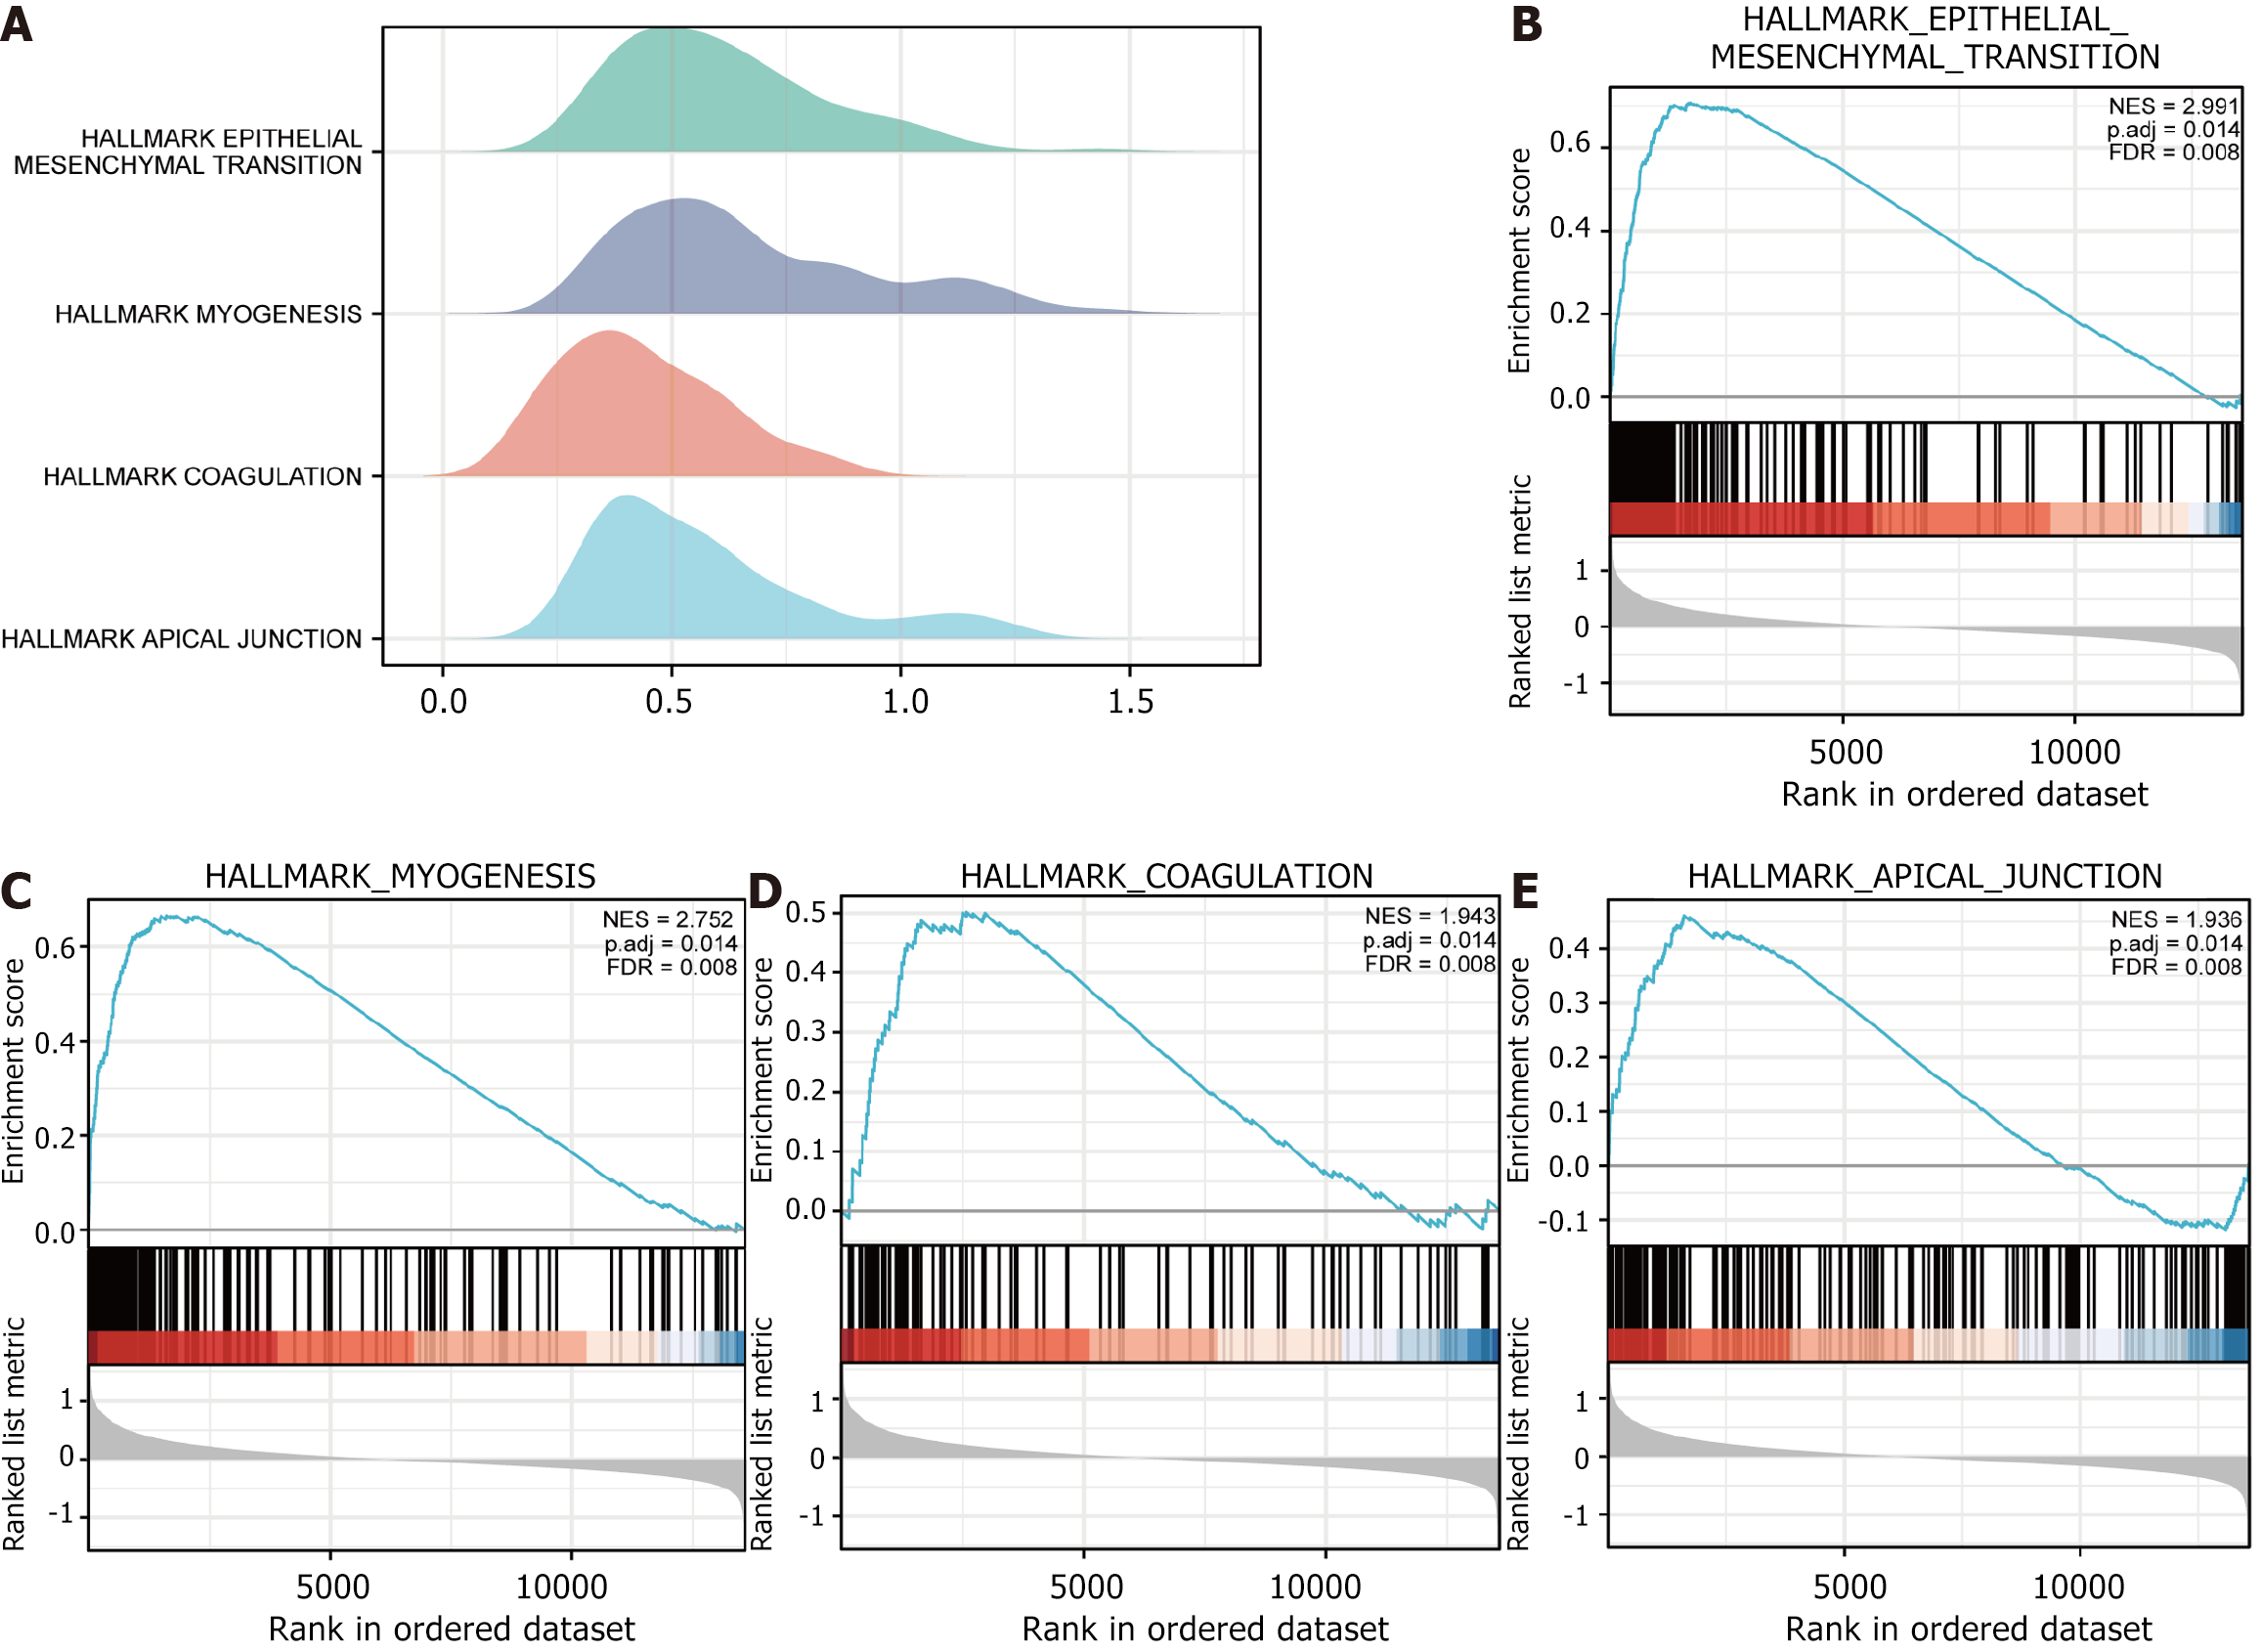
Figure 6 Gene Set Enrichment Analysis of the dataset The Cancer Genome Atlas-stomach adenocarcinoma.
A: Mountain plot of Gene Set Enrichment Analysis (GSEA) results for the dataset The Cancer Genome Atlas (TCGA)-stomach adenocarcinoma (STAD) for gastric cancer (STAD); B: GSEA of all genes in the dataset TCGA-STAD in high and low risk subgroups (subgroup: High and subgroup: Low) vs HALLMARK_EPITHELIAL_MESENCHY
- Citation: Xie XZ, Zuo L, Huang W, Fan QM, Weng YY, Yao WD, Jiang JL, Jin JQ. FDX1 as a novel biomarker and treatment target for stomach adenocarcinoma. World J Gastrointest Surg 2024; 16(6): 1803-1824
- URL: https://www.wjgnet.com/1948-9366/full/v16/i6/1803.htm
- DOI: https://dx.doi.org/10.4240/wjgs.v16.i6.1803


