Copyright
©The Author(s) 2024.
World J Gastrointest Surg. Jun 27, 2024; 16(6): 1803-1824
Published online Jun 27, 2024. doi: 10.4240/wjgs.v16.i6.1803
Published online Jun 27, 2024. doi: 10.4240/wjgs.v16.i6.1803
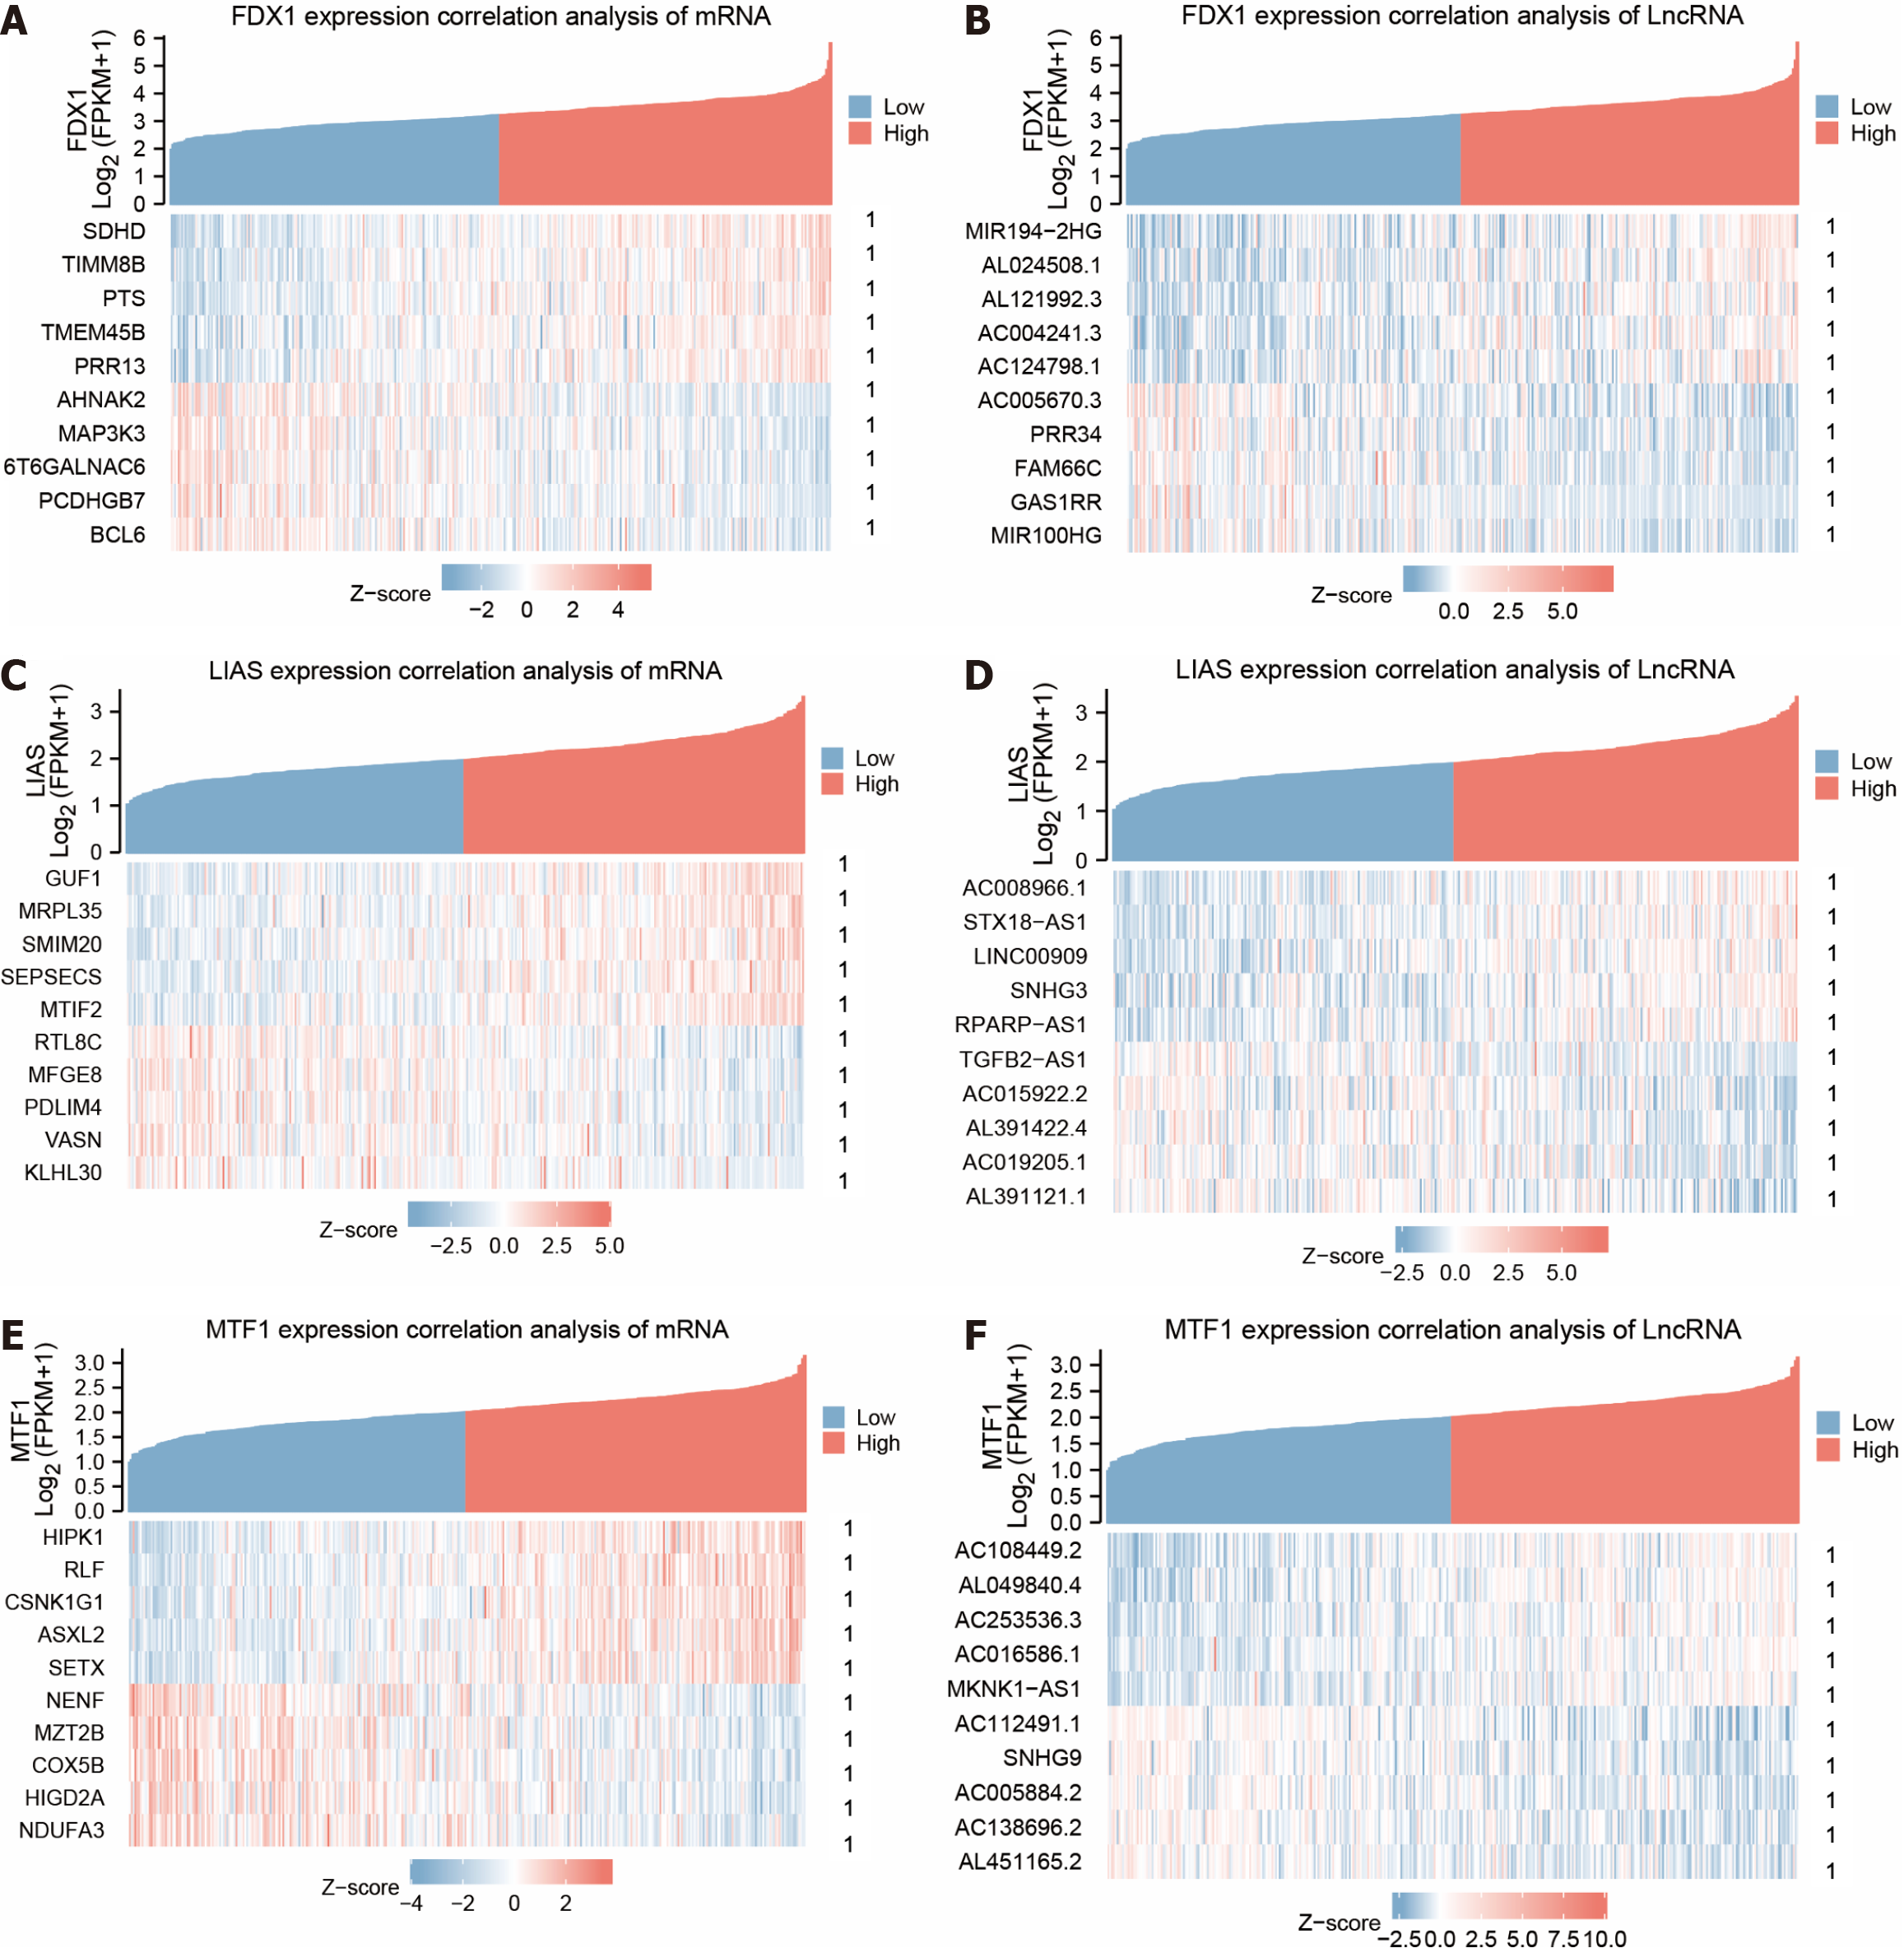
Figure 4 Co-expression heat map of differentially expressed genes for copper death prognosis.
A: Heat map of gene FDX1 co-expression with genotypes of protein-coding molecules with positive correlation Top5 and negative correlation Top5 genes; B: Heat map of gene FDX1 co-expression with genotypes of LncRNA molecules with positive correlation Top5 and negative correlation Top5 genes; C: Heat map of gene LIAS co-expression with genotypes of protein-coding molecules with positive correlation Top5 and negative correlation Top5 genes; D: Co-expression heat map of gene LIAS with genotype LncRNA molecules for positively associated Top5 and negatively associated Top5 genes; E: Co-expression heat map of gene MTF1 with genotype protein-coding molecules for positively associated Top5 and negatively associated Top5 genes; F: Co-expression heat map of gene MTF1 with genotype LncRNA molecules for positively associated Top5 and negatively associated Top5 genes. Negatively related Top5 genes co-expression heat map. 1P < 0.001, which is highly statistically significant.
- Citation: Xie XZ, Zuo L, Huang W, Fan QM, Weng YY, Yao WD, Jiang JL, Jin JQ. FDX1 as a novel biomarker and treatment target for stomach adenocarcinoma. World J Gastrointest Surg 2024; 16(6): 1803-1824
- URL: https://www.wjgnet.com/1948-9366/full/v16/i6/1803.htm
- DOI: https://dx.doi.org/10.4240/wjgs.v16.i6.1803


