Copyright
©The Author(s) 2024.
World J Gastrointest Surg. Jun 27, 2024; 16(6): 1803-1824
Published online Jun 27, 2024. doi: 10.4240/wjgs.v16.i6.1803
Published online Jun 27, 2024. doi: 10.4240/wjgs.v16.i6.1803
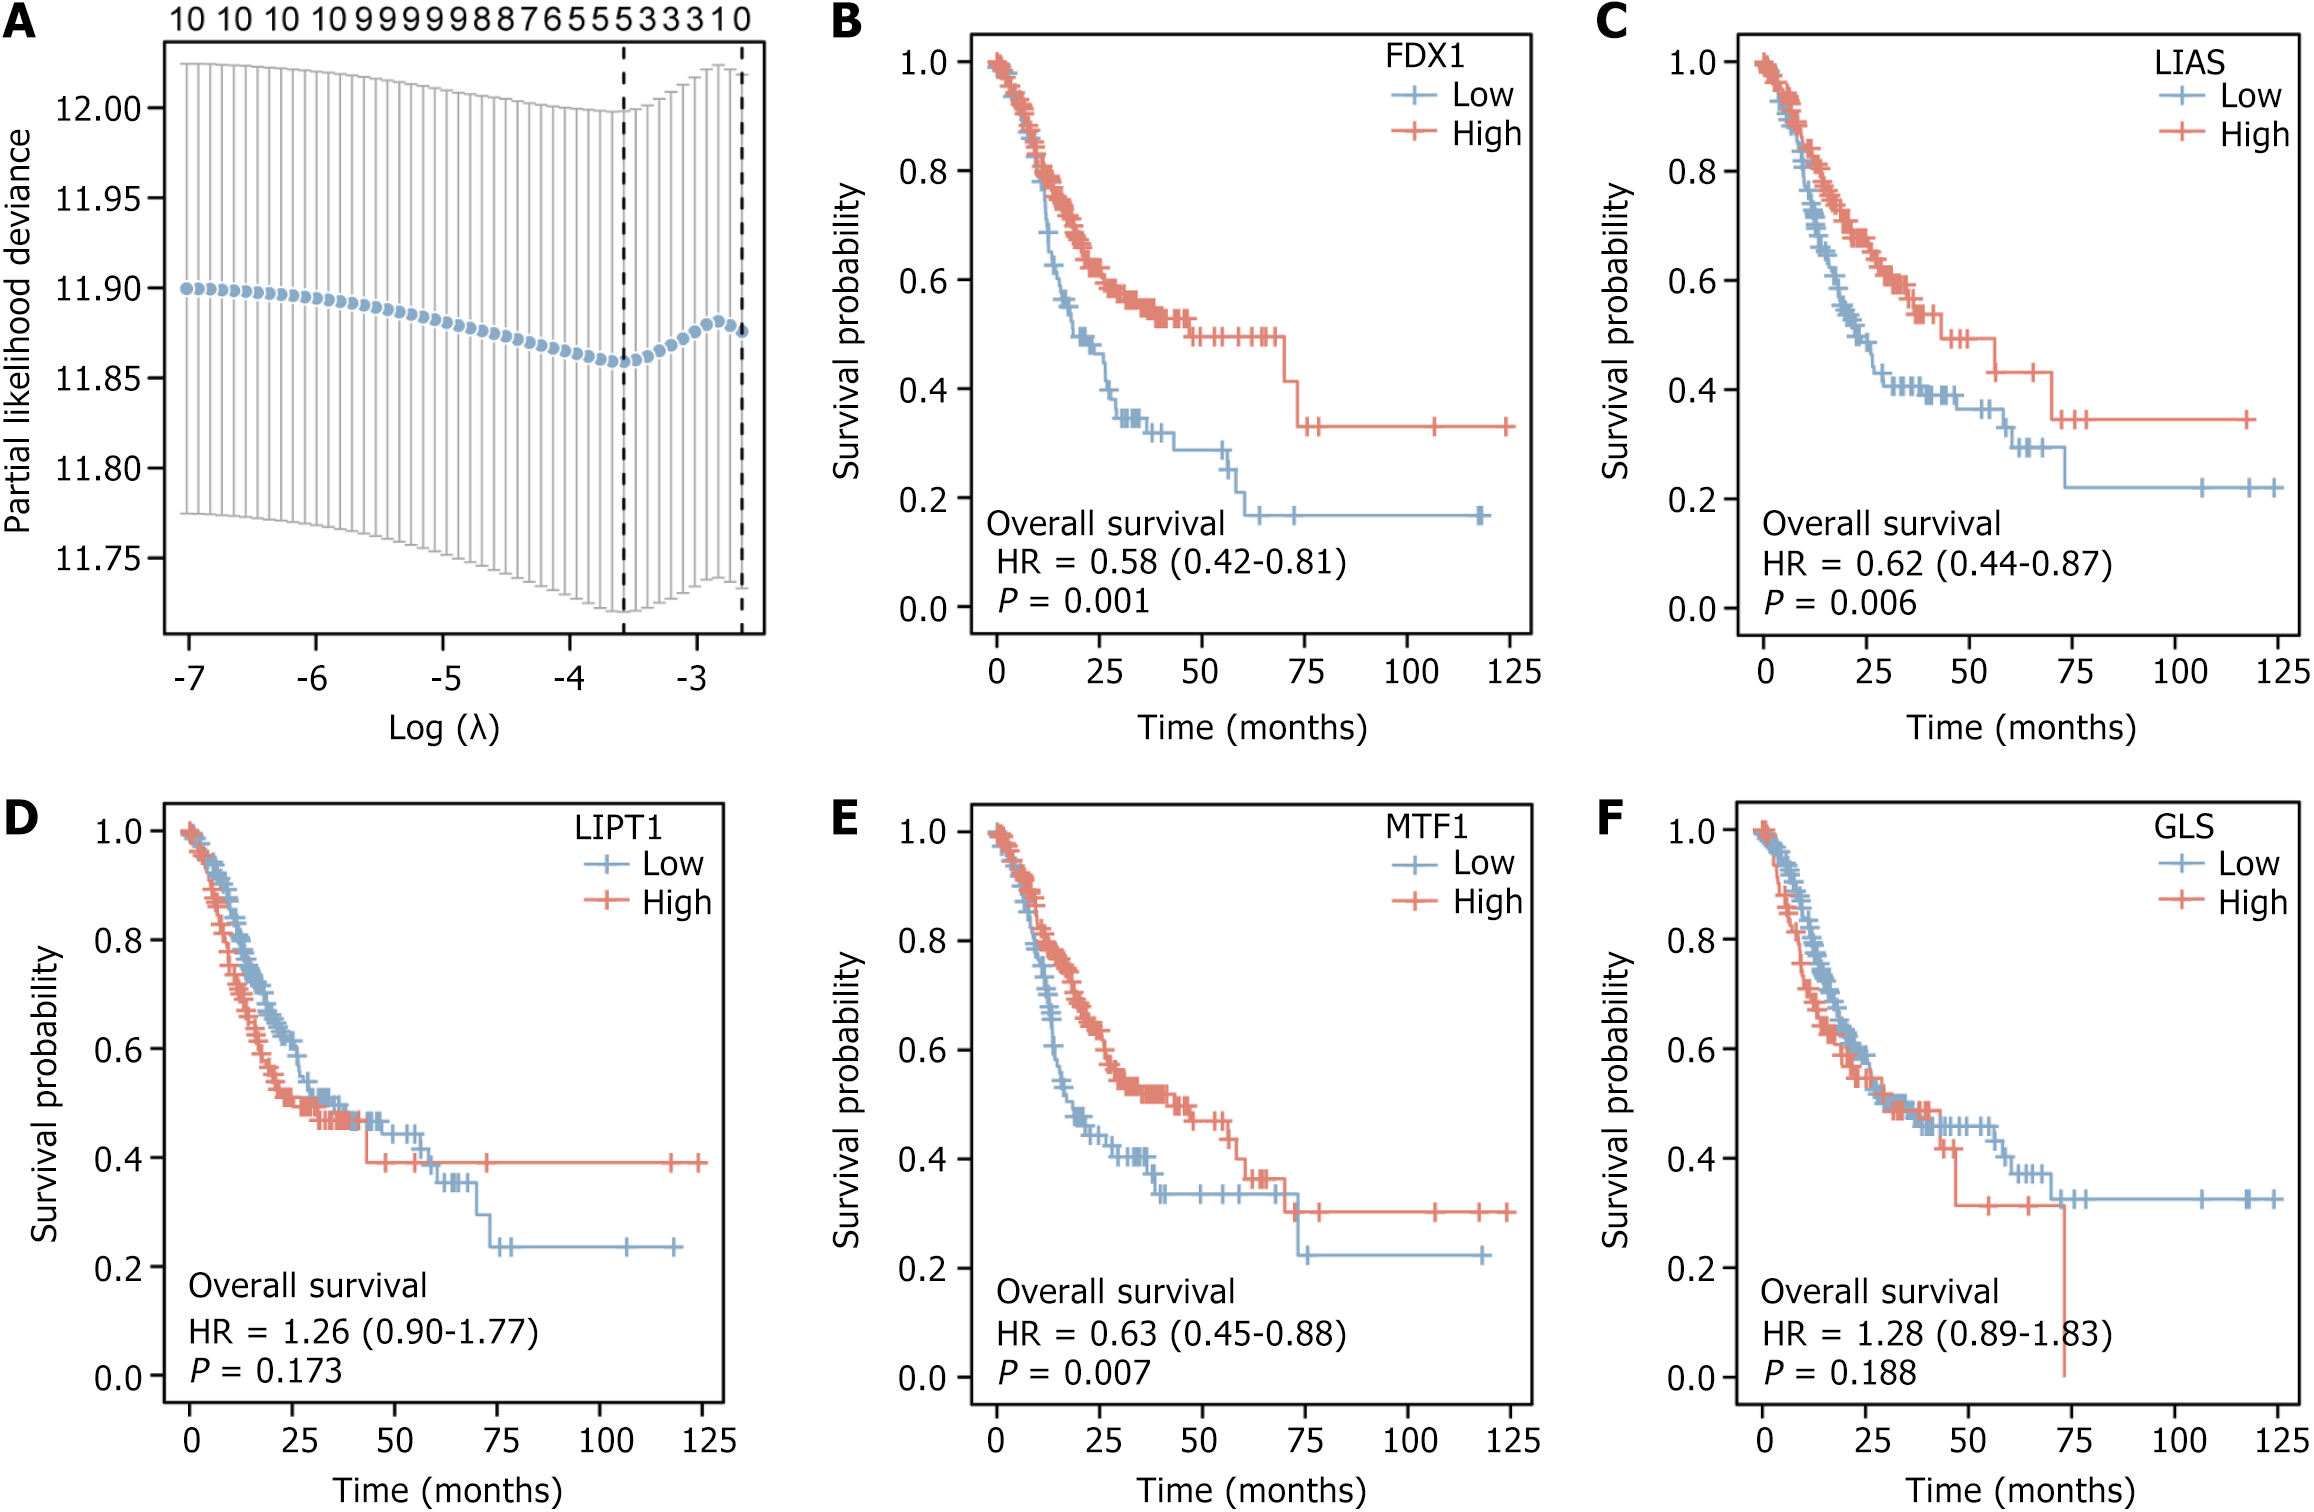
Figure 2 Visualisation of Least Absolute Shrinkage and Selection Operator regression results and Kaplan-Meier curves.
A: Visualization of Least Absolute Shrinkage and Selection Operator regression results for dataset The Cancer Genome Atlas (TCGA)-stomach adenocarcinoma (STAD); B: Kaplan-Meier (K-M) curves for gene FDX1 in dataset TCGA-STAD; C: K-M curves for gene LIAS in dataset TCGA-STAD; D: K-M curves for gene LIPT1 in dataset TCGA-STAD; E: K-M curves for gene MTF1 in dataset TCGA-STAD; F: K-M curves for gene GLS in dataset TCGA-STAD.
- Citation: Xie XZ, Zuo L, Huang W, Fan QM, Weng YY, Yao WD, Jiang JL, Jin JQ. FDX1 as a novel biomarker and treatment target for stomach adenocarcinoma. World J Gastrointest Surg 2024; 16(6): 1803-1824
- URL: https://www.wjgnet.com/1948-9366/full/v16/i6/1803.htm
- DOI: https://dx.doi.org/10.4240/wjgs.v16.i6.1803


