Copyright
©The Author(s) 2024.
World J Gastrointest Surg. Jun 27, 2024; 16(6): 1537-1547
Published online Jun 27, 2024. doi: 10.4240/wjgs.v16.i6.1537
Published online Jun 27, 2024. doi: 10.4240/wjgs.v16.i6.1537
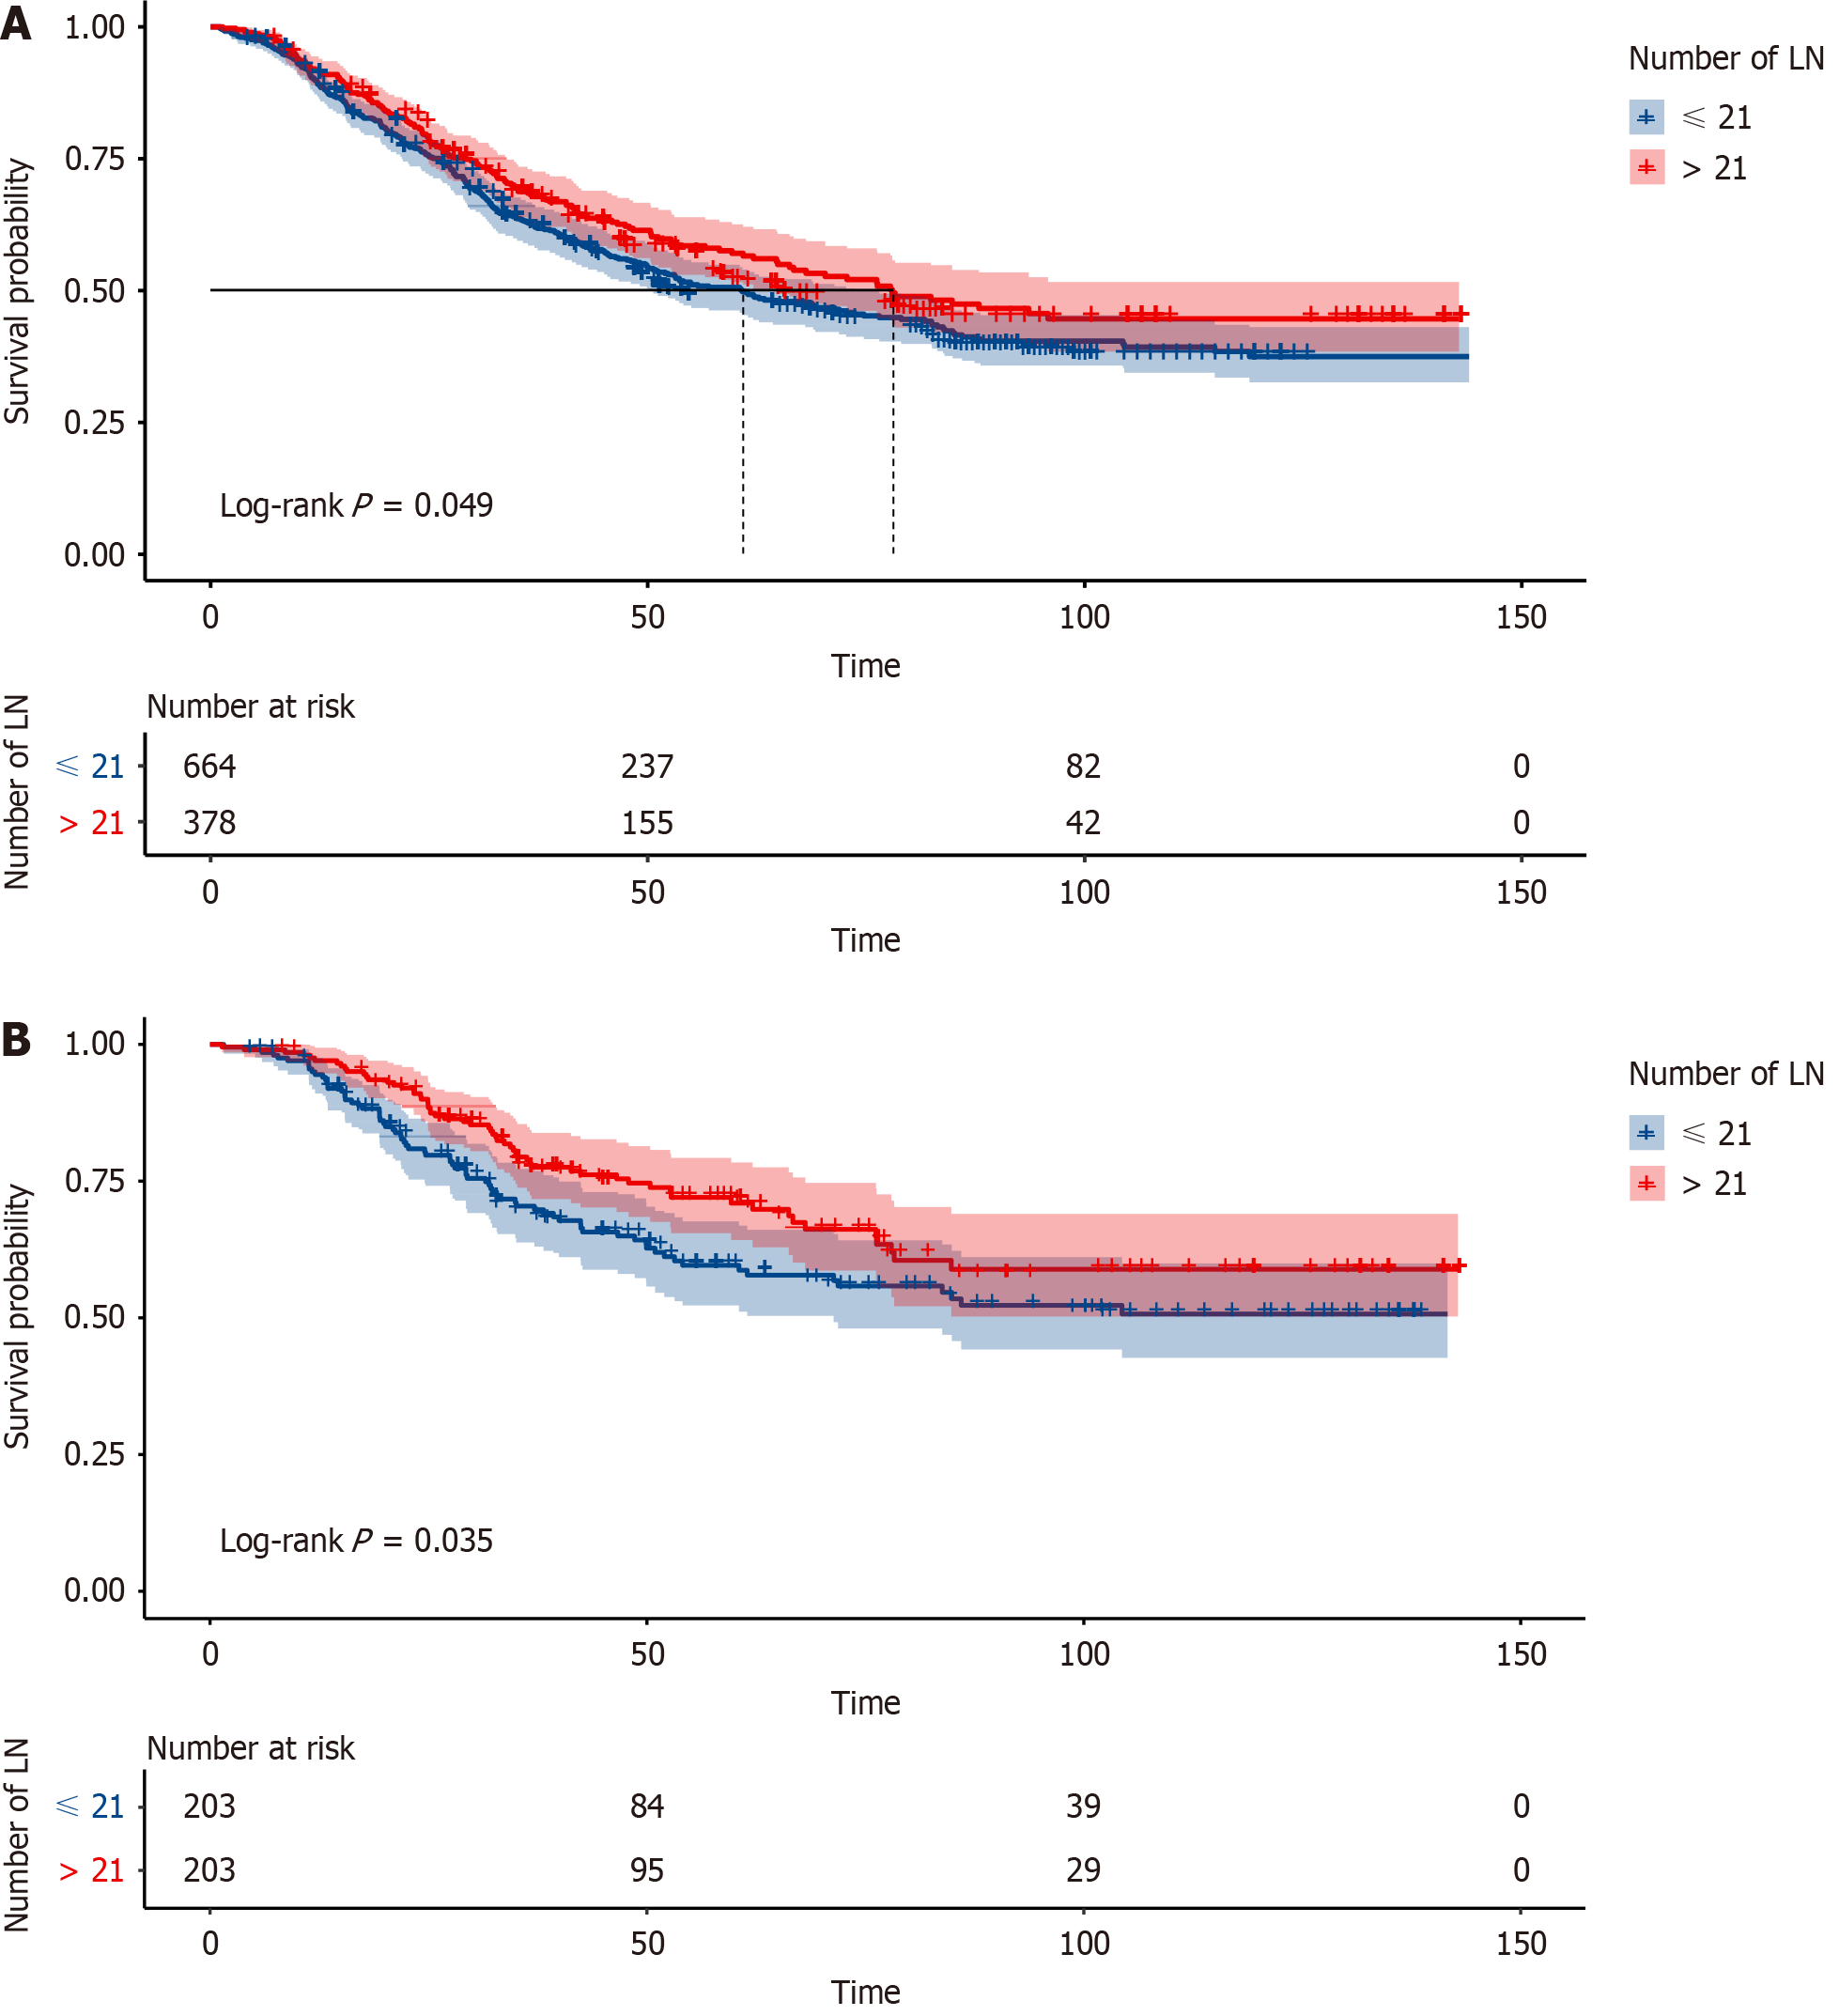
Figure 1 Kaplan-Meier curve for overall survival before and after propensity-scoring matching.
A: Survival difference between the number of removed lymph node > 21 and ≤ 21 before propensity-scoring matching; B: Survival difference between two cohorts after propensity-scoring matching. LN: Lymph nodes.
- Citation: Tang JM, Huang SJ, Chen QB, Wu HS, Qiao GB. Optimal extent of lymphadenectomy improves prognosis and guides adjuvant chemotherapy in esophageal cancer: A propensity score-matched analysis. World J Gastrointest Surg 2024; 16(6): 1537-1547
- URL: https://www.wjgnet.com/1948-9366/full/v16/i6/1537.htm
- DOI: https://dx.doi.org/10.4240/wjgs.v16.i6.1537


