Copyright
©The Author(s) 2024.
World J Gastrointest Surg. May 27, 2024; 16(5): 1407-1419
Published online May 27, 2024. doi: 10.4240/wjgs.v16.i5.1407
Published online May 27, 2024. doi: 10.4240/wjgs.v16.i5.1407
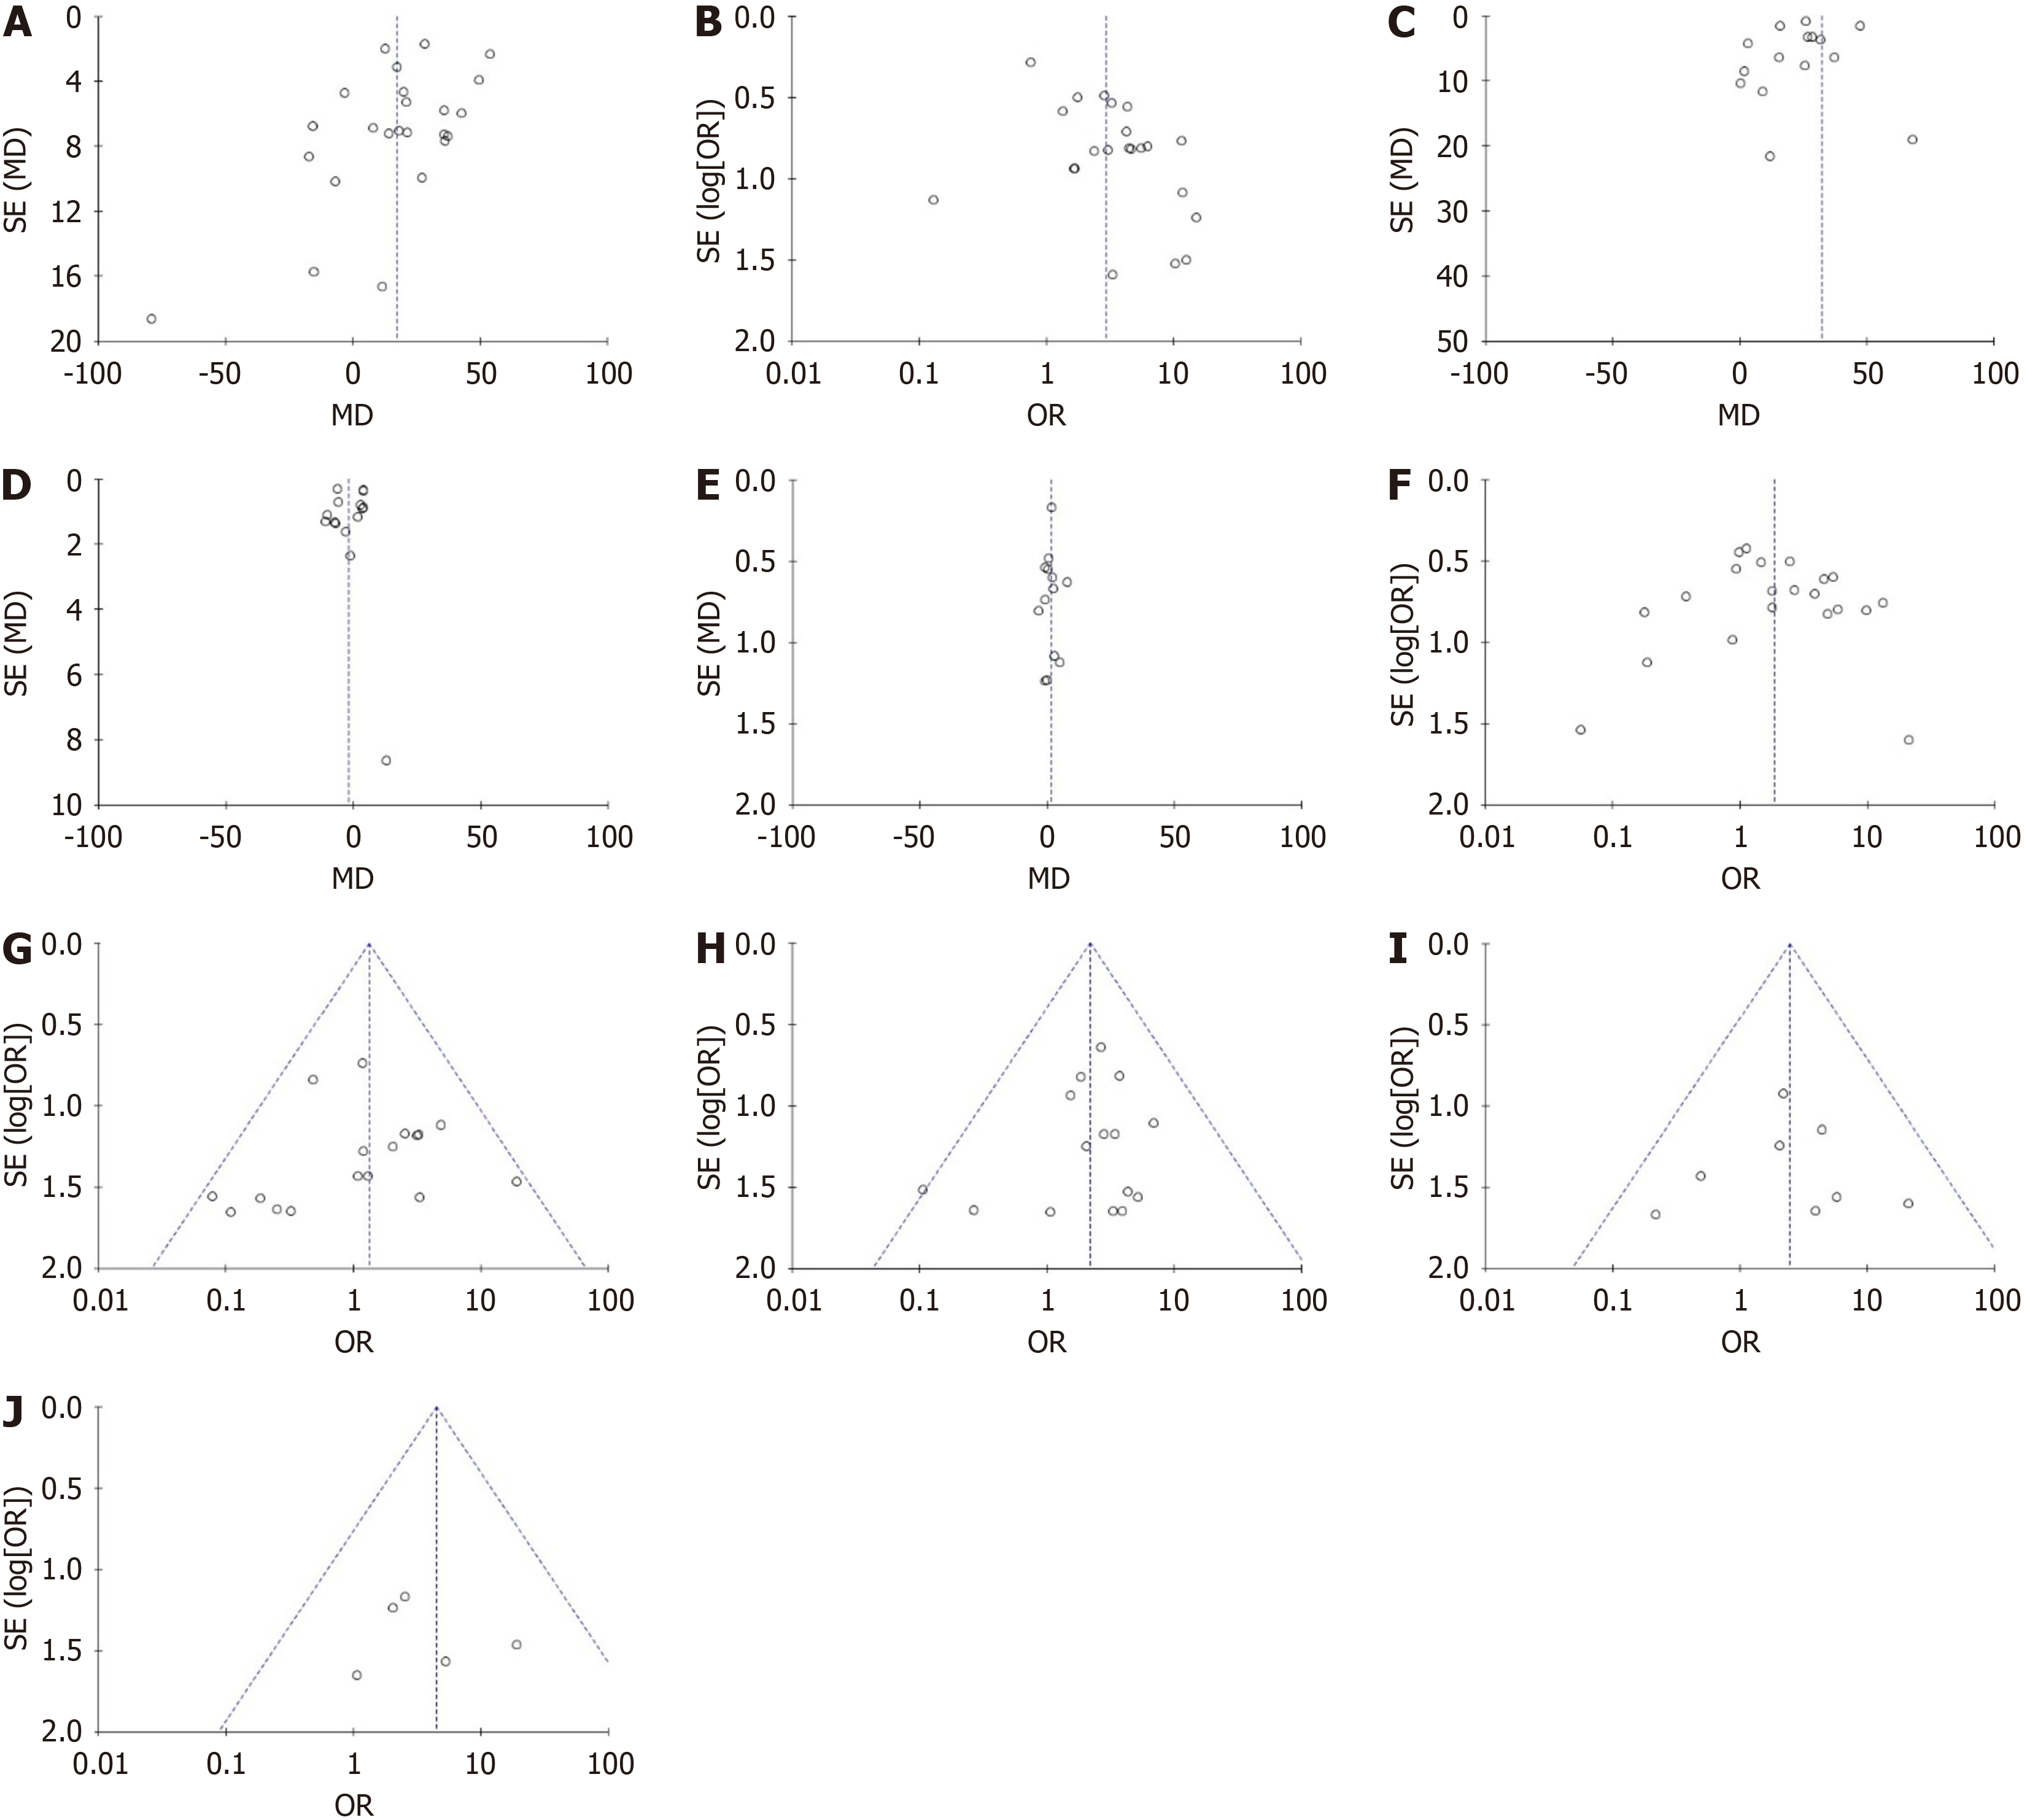
Figure 3 Funnel plots of each outcome.
A: Operative time; B: Conversion rate to open surgery; C: Intraoperative bleeding; D: Overall hospital stay; E: Postoperative hospital stay; F: Postoperative complications; G: Bile leakage; H: Wound infection; I: Intraperitoneal hemorrhage; J: Bile duct injury. MD: Mean difference; OR: Odds ratio.
- Citation: Li Y, Xiao WK, Li XJ, Dong HY. Evaluating effectiveness and safety of combined percutaneous transhepatic gallbladder drainage and laparoscopic cholecystectomy in acute cholecystitis patients: Meta-analysis. World J Gastrointest Surg 2024; 16(5): 1407-1419
- URL: https://www.wjgnet.com/1948-9366/full/v16/i5/1407.htm
- DOI: https://dx.doi.org/10.4240/wjgs.v16.i5.1407


