Copyright
©The Author(s) 2024.
World J Gastrointest Surg. May 27, 2024; 16(5): 1301-1310
Published online May 27, 2024. doi: 10.4240/wjgs.v16.i5.1301
Published online May 27, 2024. doi: 10.4240/wjgs.v16.i5.1301
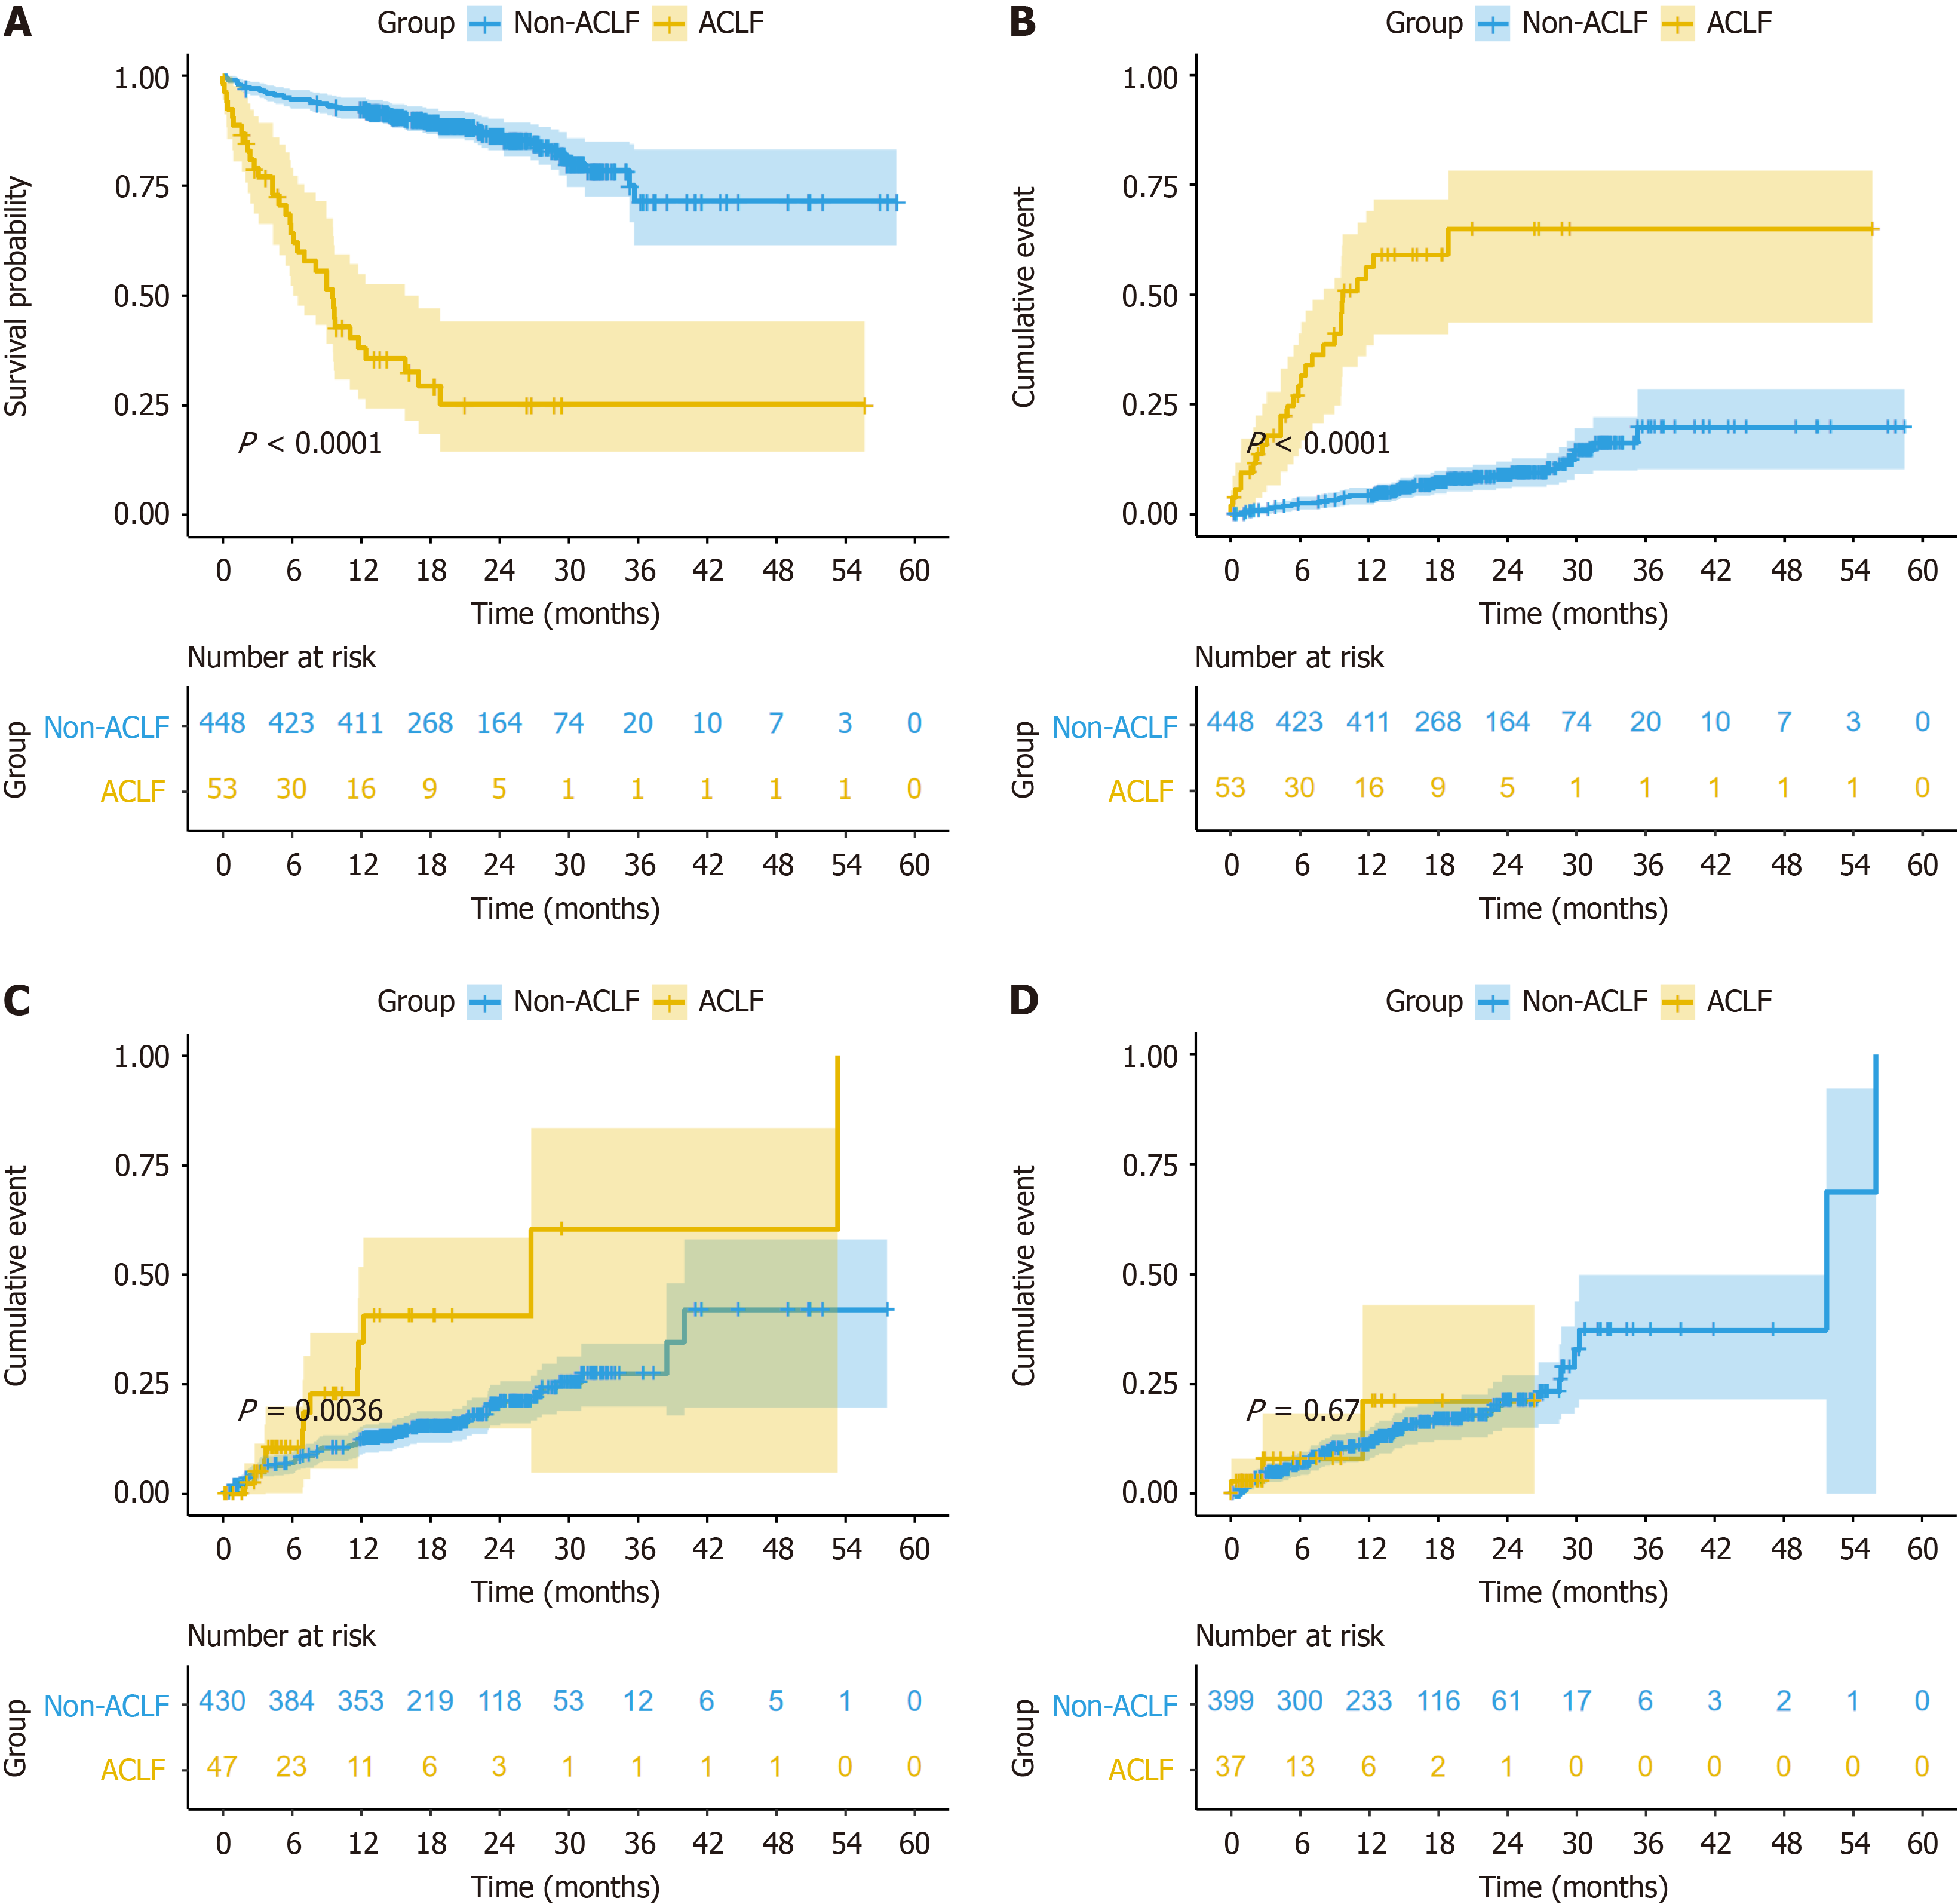
Figure 5 The prognosis between the acute-on-chronic liver failure group and the non-acute-on-chronic liver failure group.
A: The Kaplan-Meier curve shows the probability of survival; B: The Kaplan-Meier curve shows the liver disease-related mortality rates; C: The Kaplan-Meier curve shows the rebleeding rates; D: The Kaplan-Meier curve shows the probability of stent stenosis. ACLF: Acute-on-chronic liver failure.
- Citation: Zhang W, Jin YN, Sun C, Zhang XF, Li RQ, Yin Q, Chen JJ, Zhuge YZ. Development and validation of a predictive model for acute-on-chronic liver failure after transjugular intrahepatic portosystemic shunt. World J Gastrointest Surg 2024; 16(5): 1301-1310
- URL: https://www.wjgnet.com/1948-9366/full/v16/i5/1301.htm
- DOI: https://dx.doi.org/10.4240/wjgs.v16.i5.1301


