Copyright
©The Author(s) 2024.
World J Gastrointest Surg. Apr 27, 2024; 16(4): 1109-1120
Published online Apr 27, 2024. doi: 10.4240/wjgs.v16.i4.1109
Published online Apr 27, 2024. doi: 10.4240/wjgs.v16.i4.1109
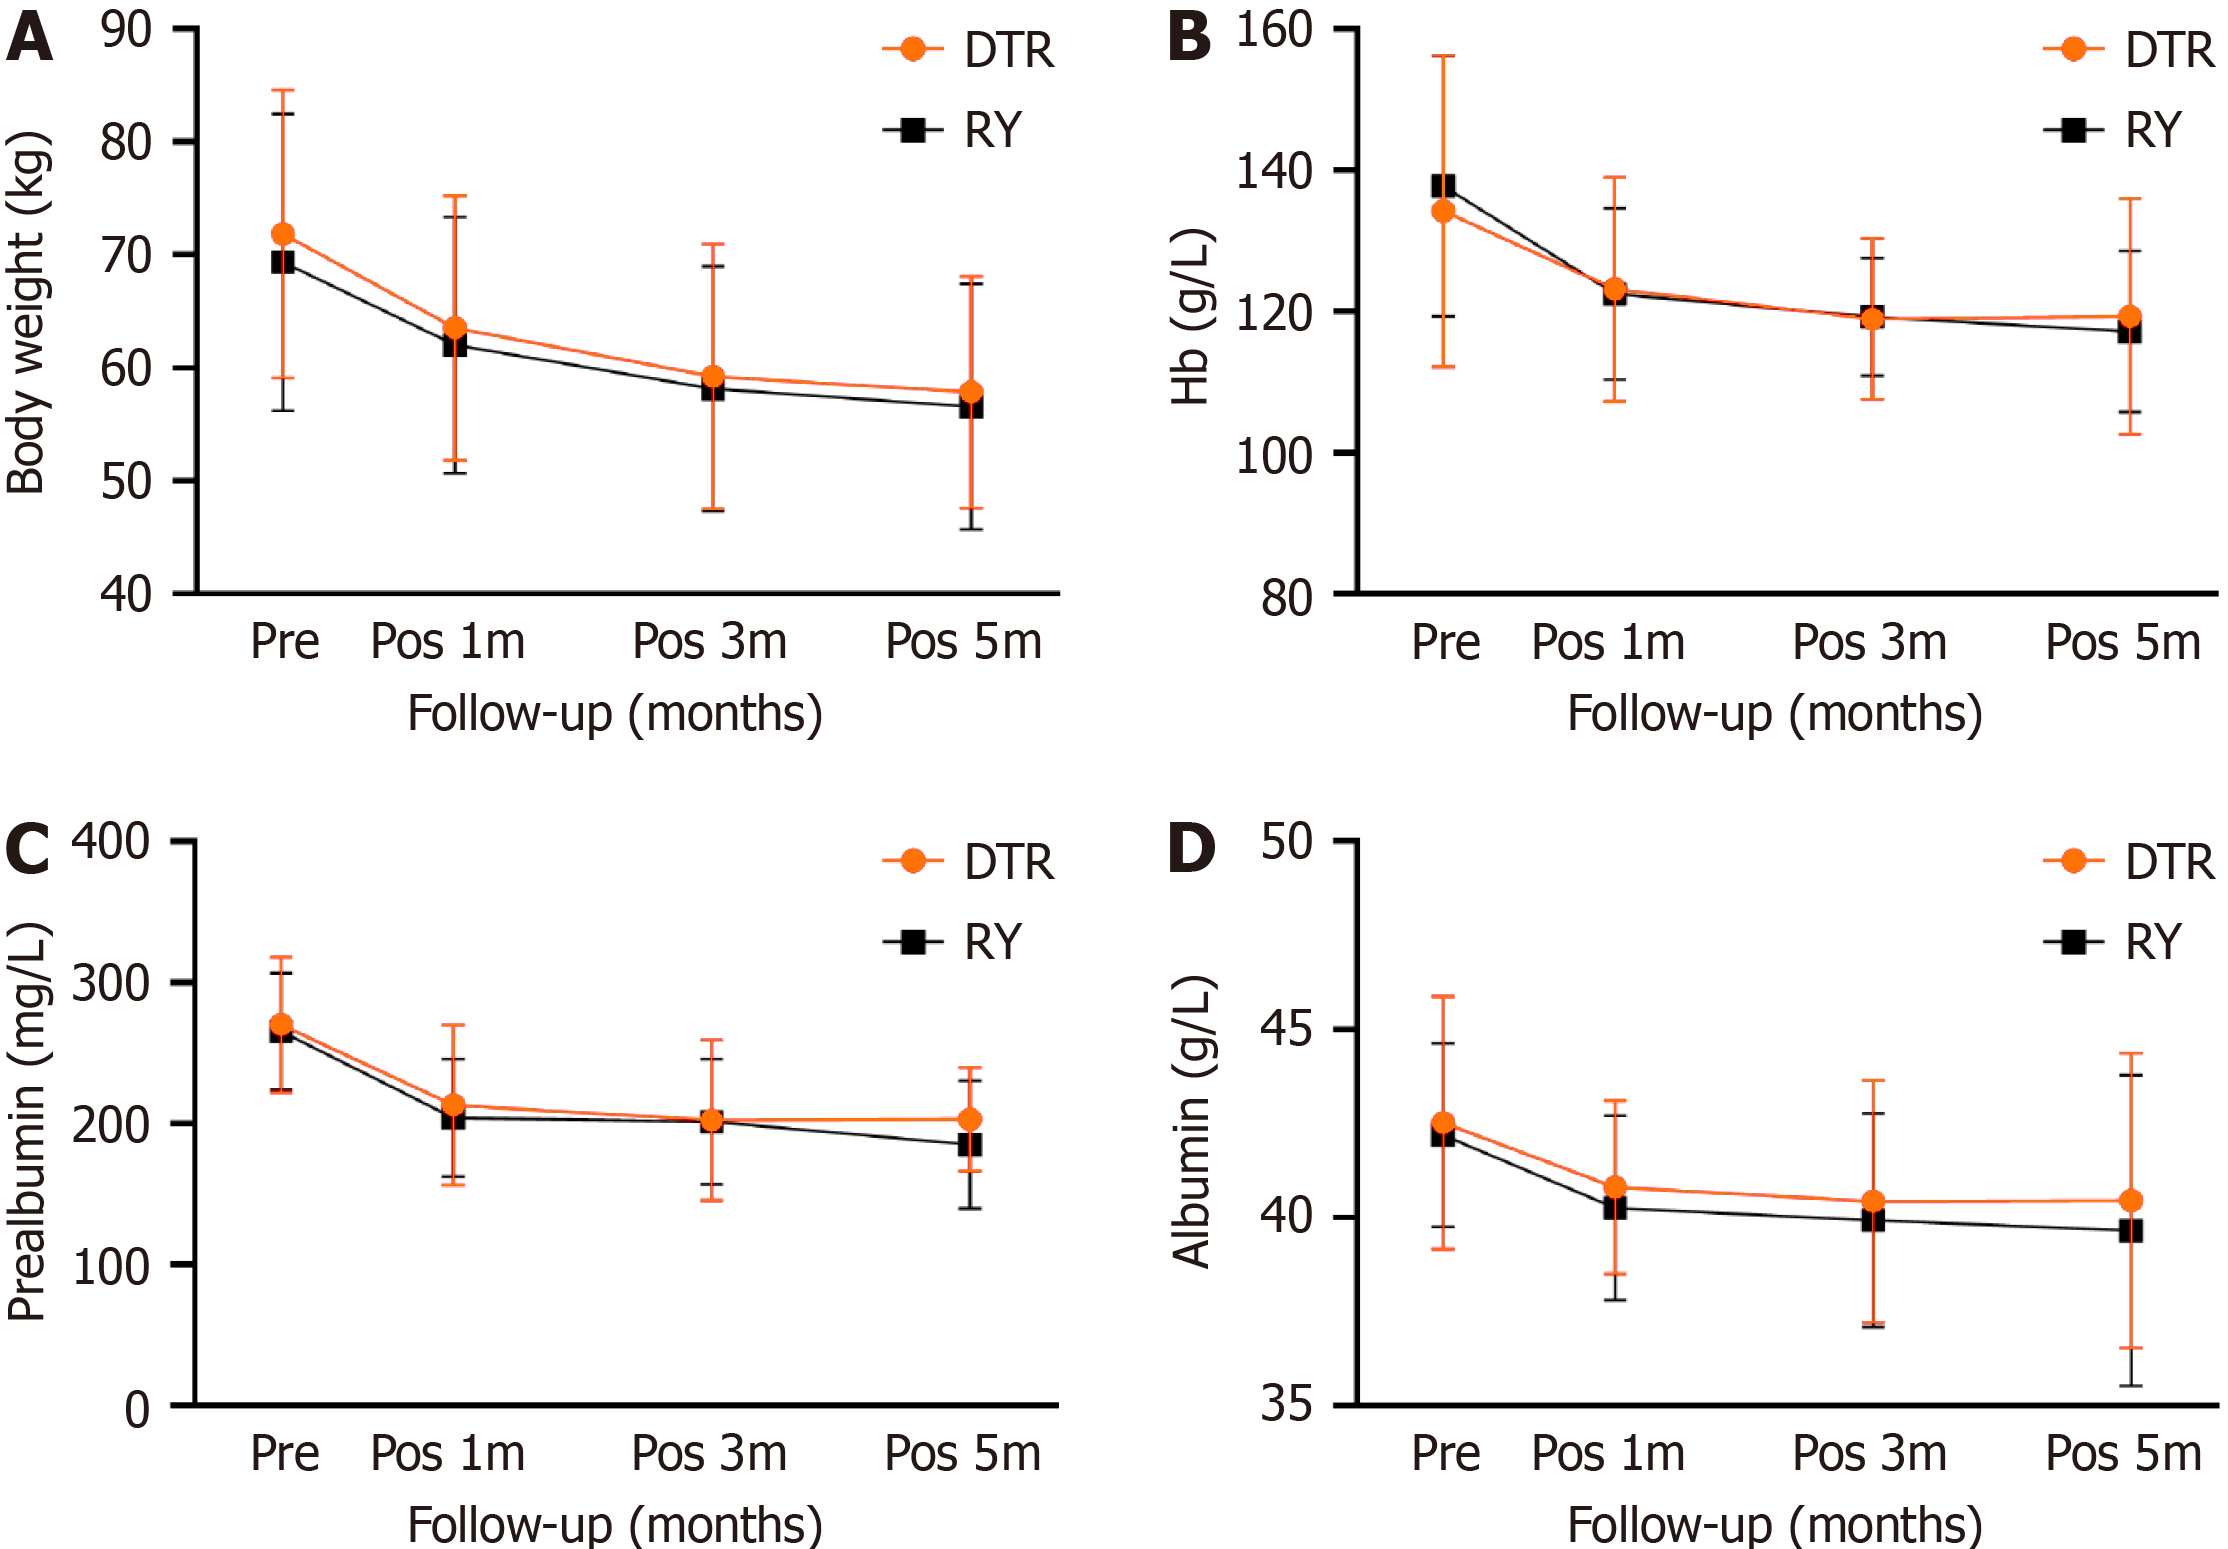
Figure 3 Line chart showing the body weight, prealbumin, albumin, and hemoglobin changes of the two groups of patients.
A: Body weight change line chart; B: Hemoglobin change line chart; C: Prealbumin change line chart; D: Albumin change line chart. DTR: Double-tract reconstruction; RY: Roux-en-Y reconstruction; Hb: Hemoglobin; Pre: Preoperative; Pos 1m: At 1 month after operation; Pos 3m: At 3 months after operation; Pos 6m: At 6 months after operation.
- Citation: Dong TX, Wang D, Zhao Q, Zhang ZD, Zhao XF, Tan BB, Liu Y, Liu QW, Yang PG, Ding PA, Zheng T, Li Y, Liu ZJ. Comparative analysis of two digestive tract reconstruction methods in total laparoscopic radical total gastrectomy. World J Gastrointest Surg 2024; 16(4): 1109-1120
- URL: https://www.wjgnet.com/1948-9366/full/v16/i4/1109.htm
- DOI: https://dx.doi.org/10.4240/wjgs.v16.i4.1109


