Copyright
©The Author(s) 2024.
World J Gastrointest Surg. Mar 27, 2024; 16(3): 717-730
Published online Mar 27, 2024. doi: 10.4240/wjgs.v16.i3.717
Published online Mar 27, 2024. doi: 10.4240/wjgs.v16.i3.717
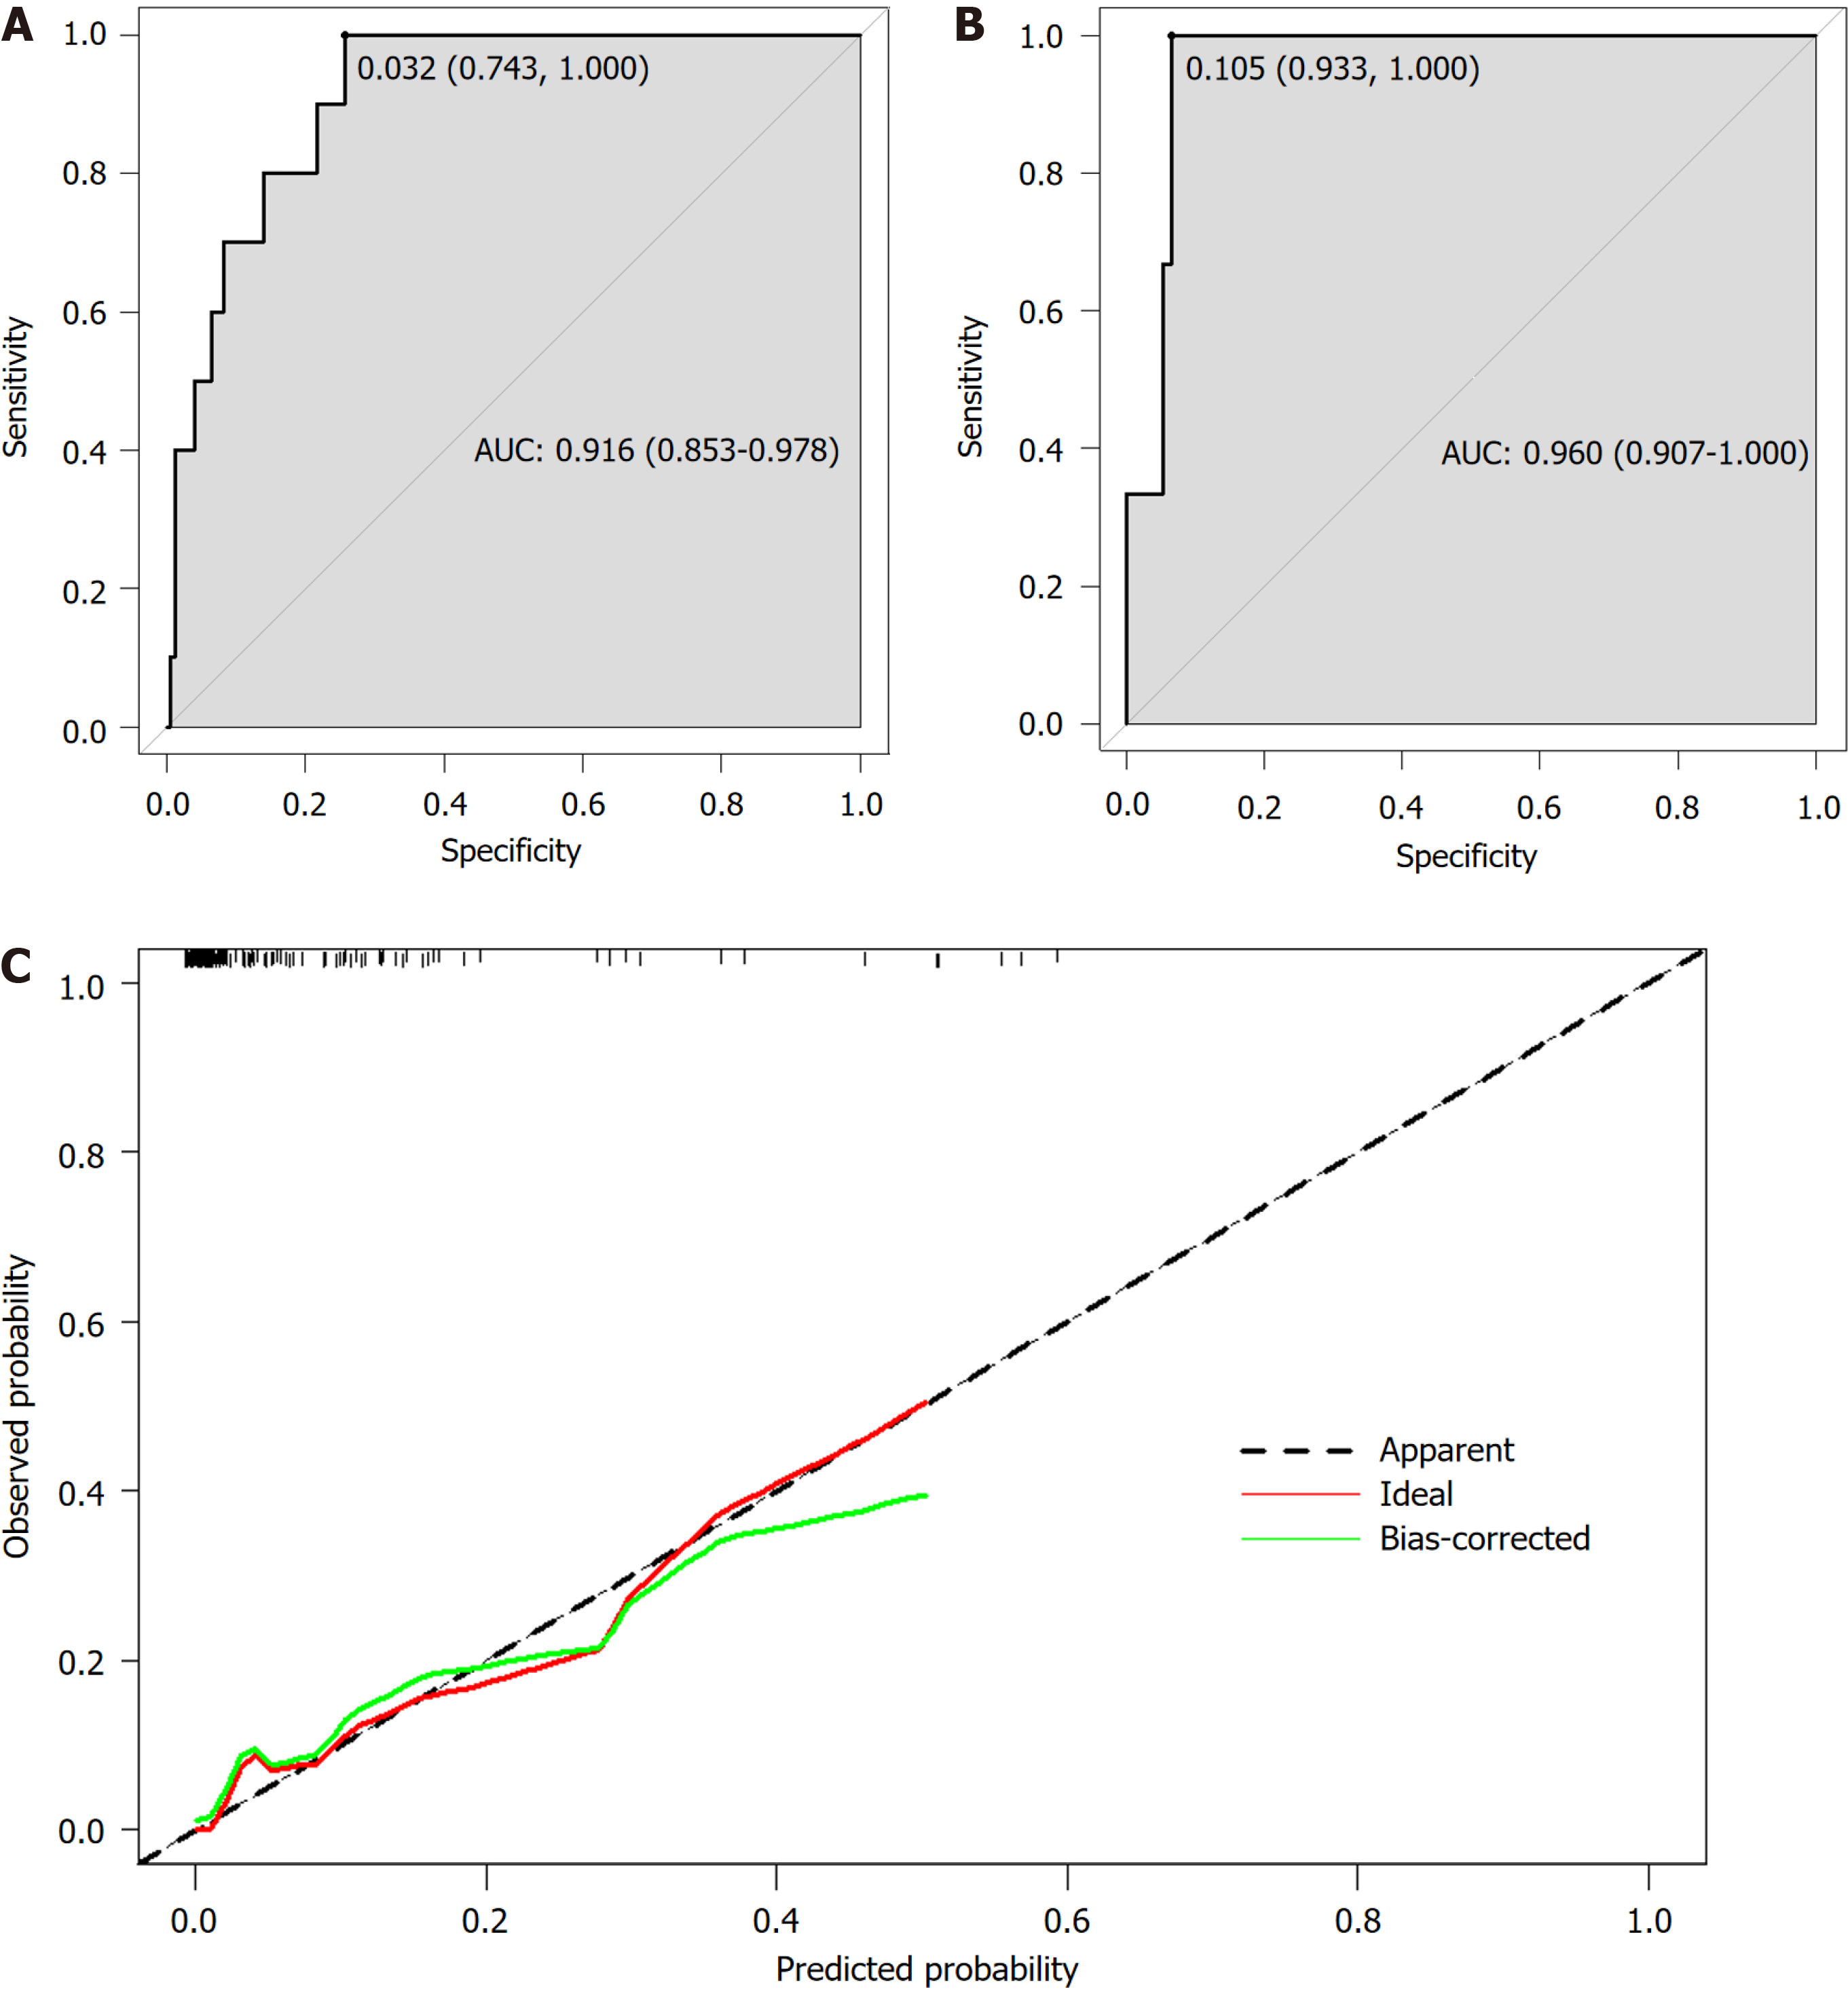
Figure 2 Evaluation of the nomogram predictive performance.
A-C: Receiver operating characteristic (ROC) curves of the nomogram for predicting the probability of postoperative complications in the training cohort (A) and the validation cohort (B). The area under ROC curve of the training cohort and the validation cohort reached 0.916 and 0.960, respectively, indicating the high predictive value of the model. The calibration curve of the nomogram is close to the front diagonal, indicating that the nomogram had good prediction performance (C). AUC: Area under the curve.
- Citation: Wang FT, Lin Y, Yuan XQ, Gao RY, Wu XC, Xu WW, Wu TQ, Xia K, Jiao YR, Yin L, Chen CQ. Predicting short-term major postoperative complications in intestinal resection for Crohn’s disease: A machine learning-based study. World J Gastrointest Surg 2024; 16(3): 717-730
- URL: https://www.wjgnet.com/1948-9366/full/v16/i3/717.htm
- DOI: https://dx.doi.org/10.4240/wjgs.v16.i3.717


