Copyright
©The Author(s) 2024.
World J Gastrointest Surg. Feb 27, 2024; 16(2): 451-462
Published online Feb 27, 2024. doi: 10.4240/wjgs.v16.i2.451
Published online Feb 27, 2024. doi: 10.4240/wjgs.v16.i2.451
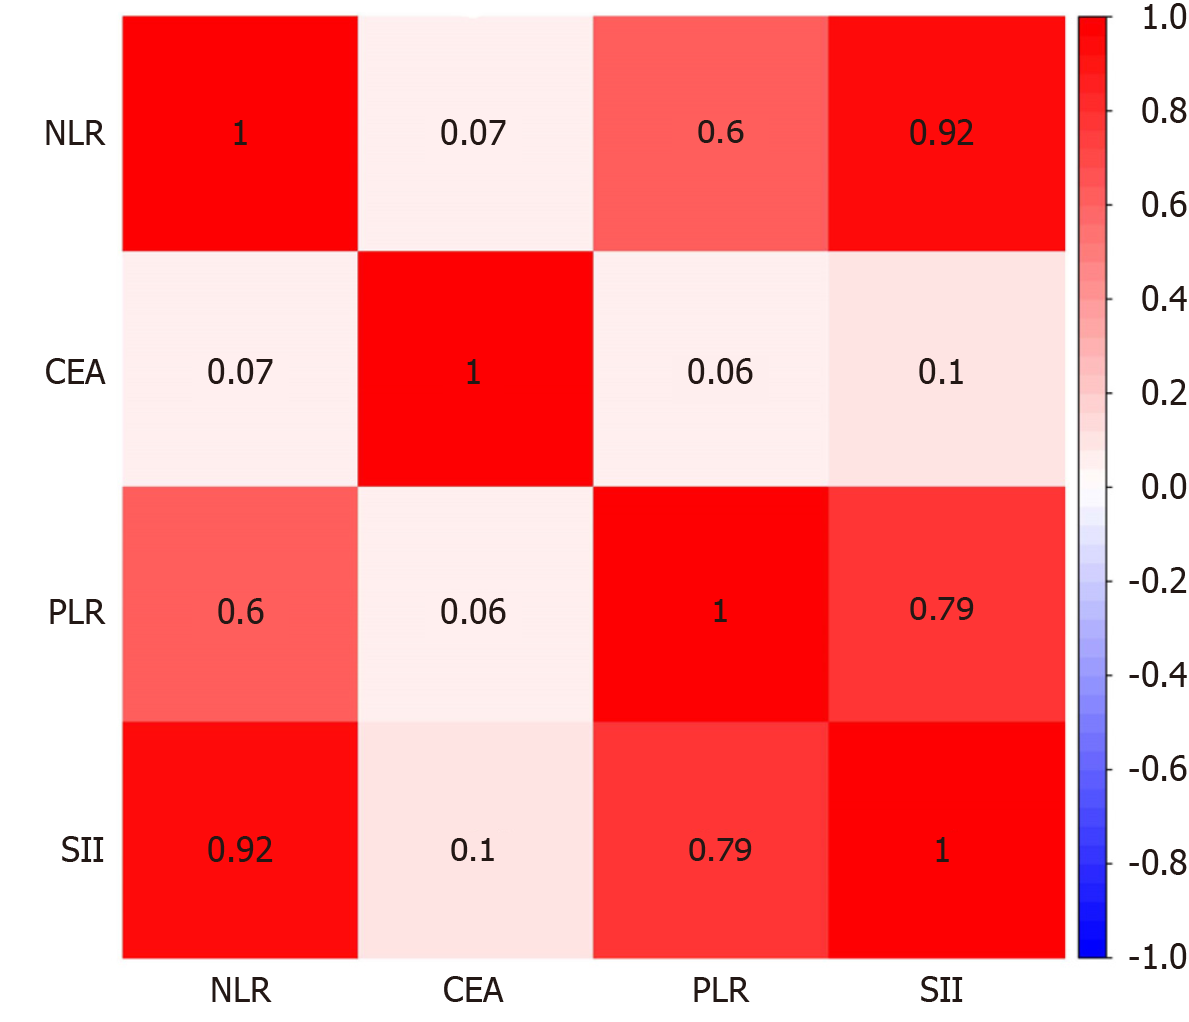
Figure 3 Spearman correlation heat map.
The darker the color, the stronger the correlation between the two indicators. NLR: Neutrophil-lymphocyte ratio; CEA: Carcinoembryonic antigen; PLR: Platelet-lymphocyte ratio; SII: Systemic immune-inflammation index.
- Citation: Liu CQ, Yu ZB, Gan JX, Mei TM. Preoperative blood markers and intra-abdominal infection after colorectal cancer resection. World J Gastrointest Surg 2024; 16(2): 451-462
- URL: https://www.wjgnet.com/1948-9366/full/v16/i2/451.htm
- DOI: https://dx.doi.org/10.4240/wjgs.v16.i2.451


