Copyright
©The Author(s) 2024.
World J Gastrointest Surg. Feb 27, 2024; 16(2): 396-408
Published online Feb 27, 2024. doi: 10.4240/wjgs.v16.i2.396
Published online Feb 27, 2024. doi: 10.4240/wjgs.v16.i2.396
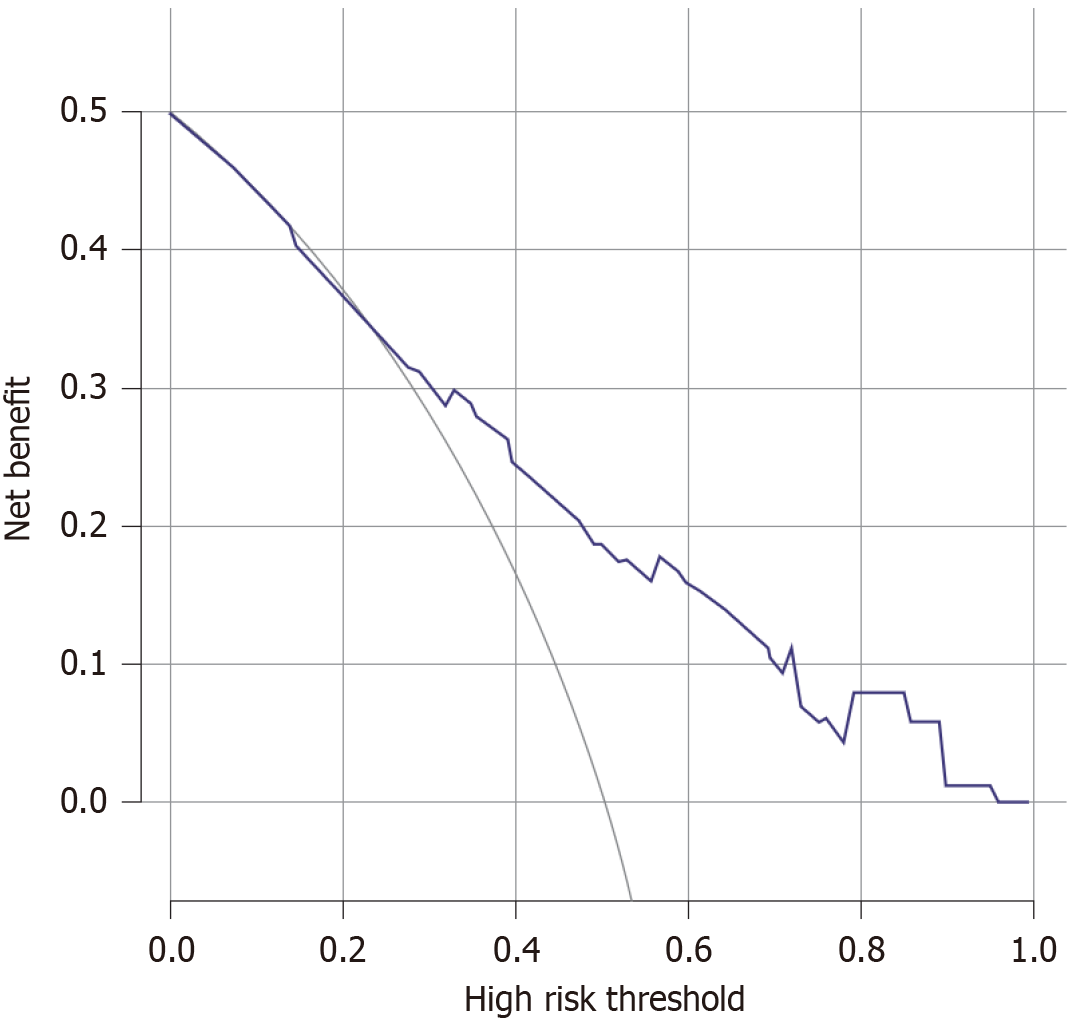
Figure 4 Decision curve analysis analyzed clinical utility of the nomogram.
The y-axis represented net benefits, and the x-axis measured threshold probability. The horizontal solid line indicated the advantage for patients not receiving neoadjuvant chemotherapy (NAC), the oblique solid line represented the advantage for patients receiving NAC, and the diagonal dotted line (nomogram) indicated survival based on nomogram scores to resolve whether a patient should receive NAC. A treatment strategy was superior if it had the highest value compared to other models, including two simple strategies, such as performing NAC for all patients (sloping solid line) or performing primary surgery first (horizontal solid line).
- Citation: Liu B, Xu YJ, Chu FR, Sun G, Zhao GD, Wang SZ. Development of a clinical nomogram for prediction of response to neoadjuvant chemotherapy in patients with advanced gastric cancer. World J Gastrointest Surg 2024; 16(2): 396-408
- URL: https://www.wjgnet.com/1948-9366/full/v16/i2/396.htm
- DOI: https://dx.doi.org/10.4240/wjgs.v16.i2.396


