Copyright
©The Author(s) 2024.
World J Gastrointest Surg. Feb 27, 2024; 16(2): 289-306
Published online Feb 27, 2024. doi: 10.4240/wjgs.v16.i2.289
Published online Feb 27, 2024. doi: 10.4240/wjgs.v16.i2.289
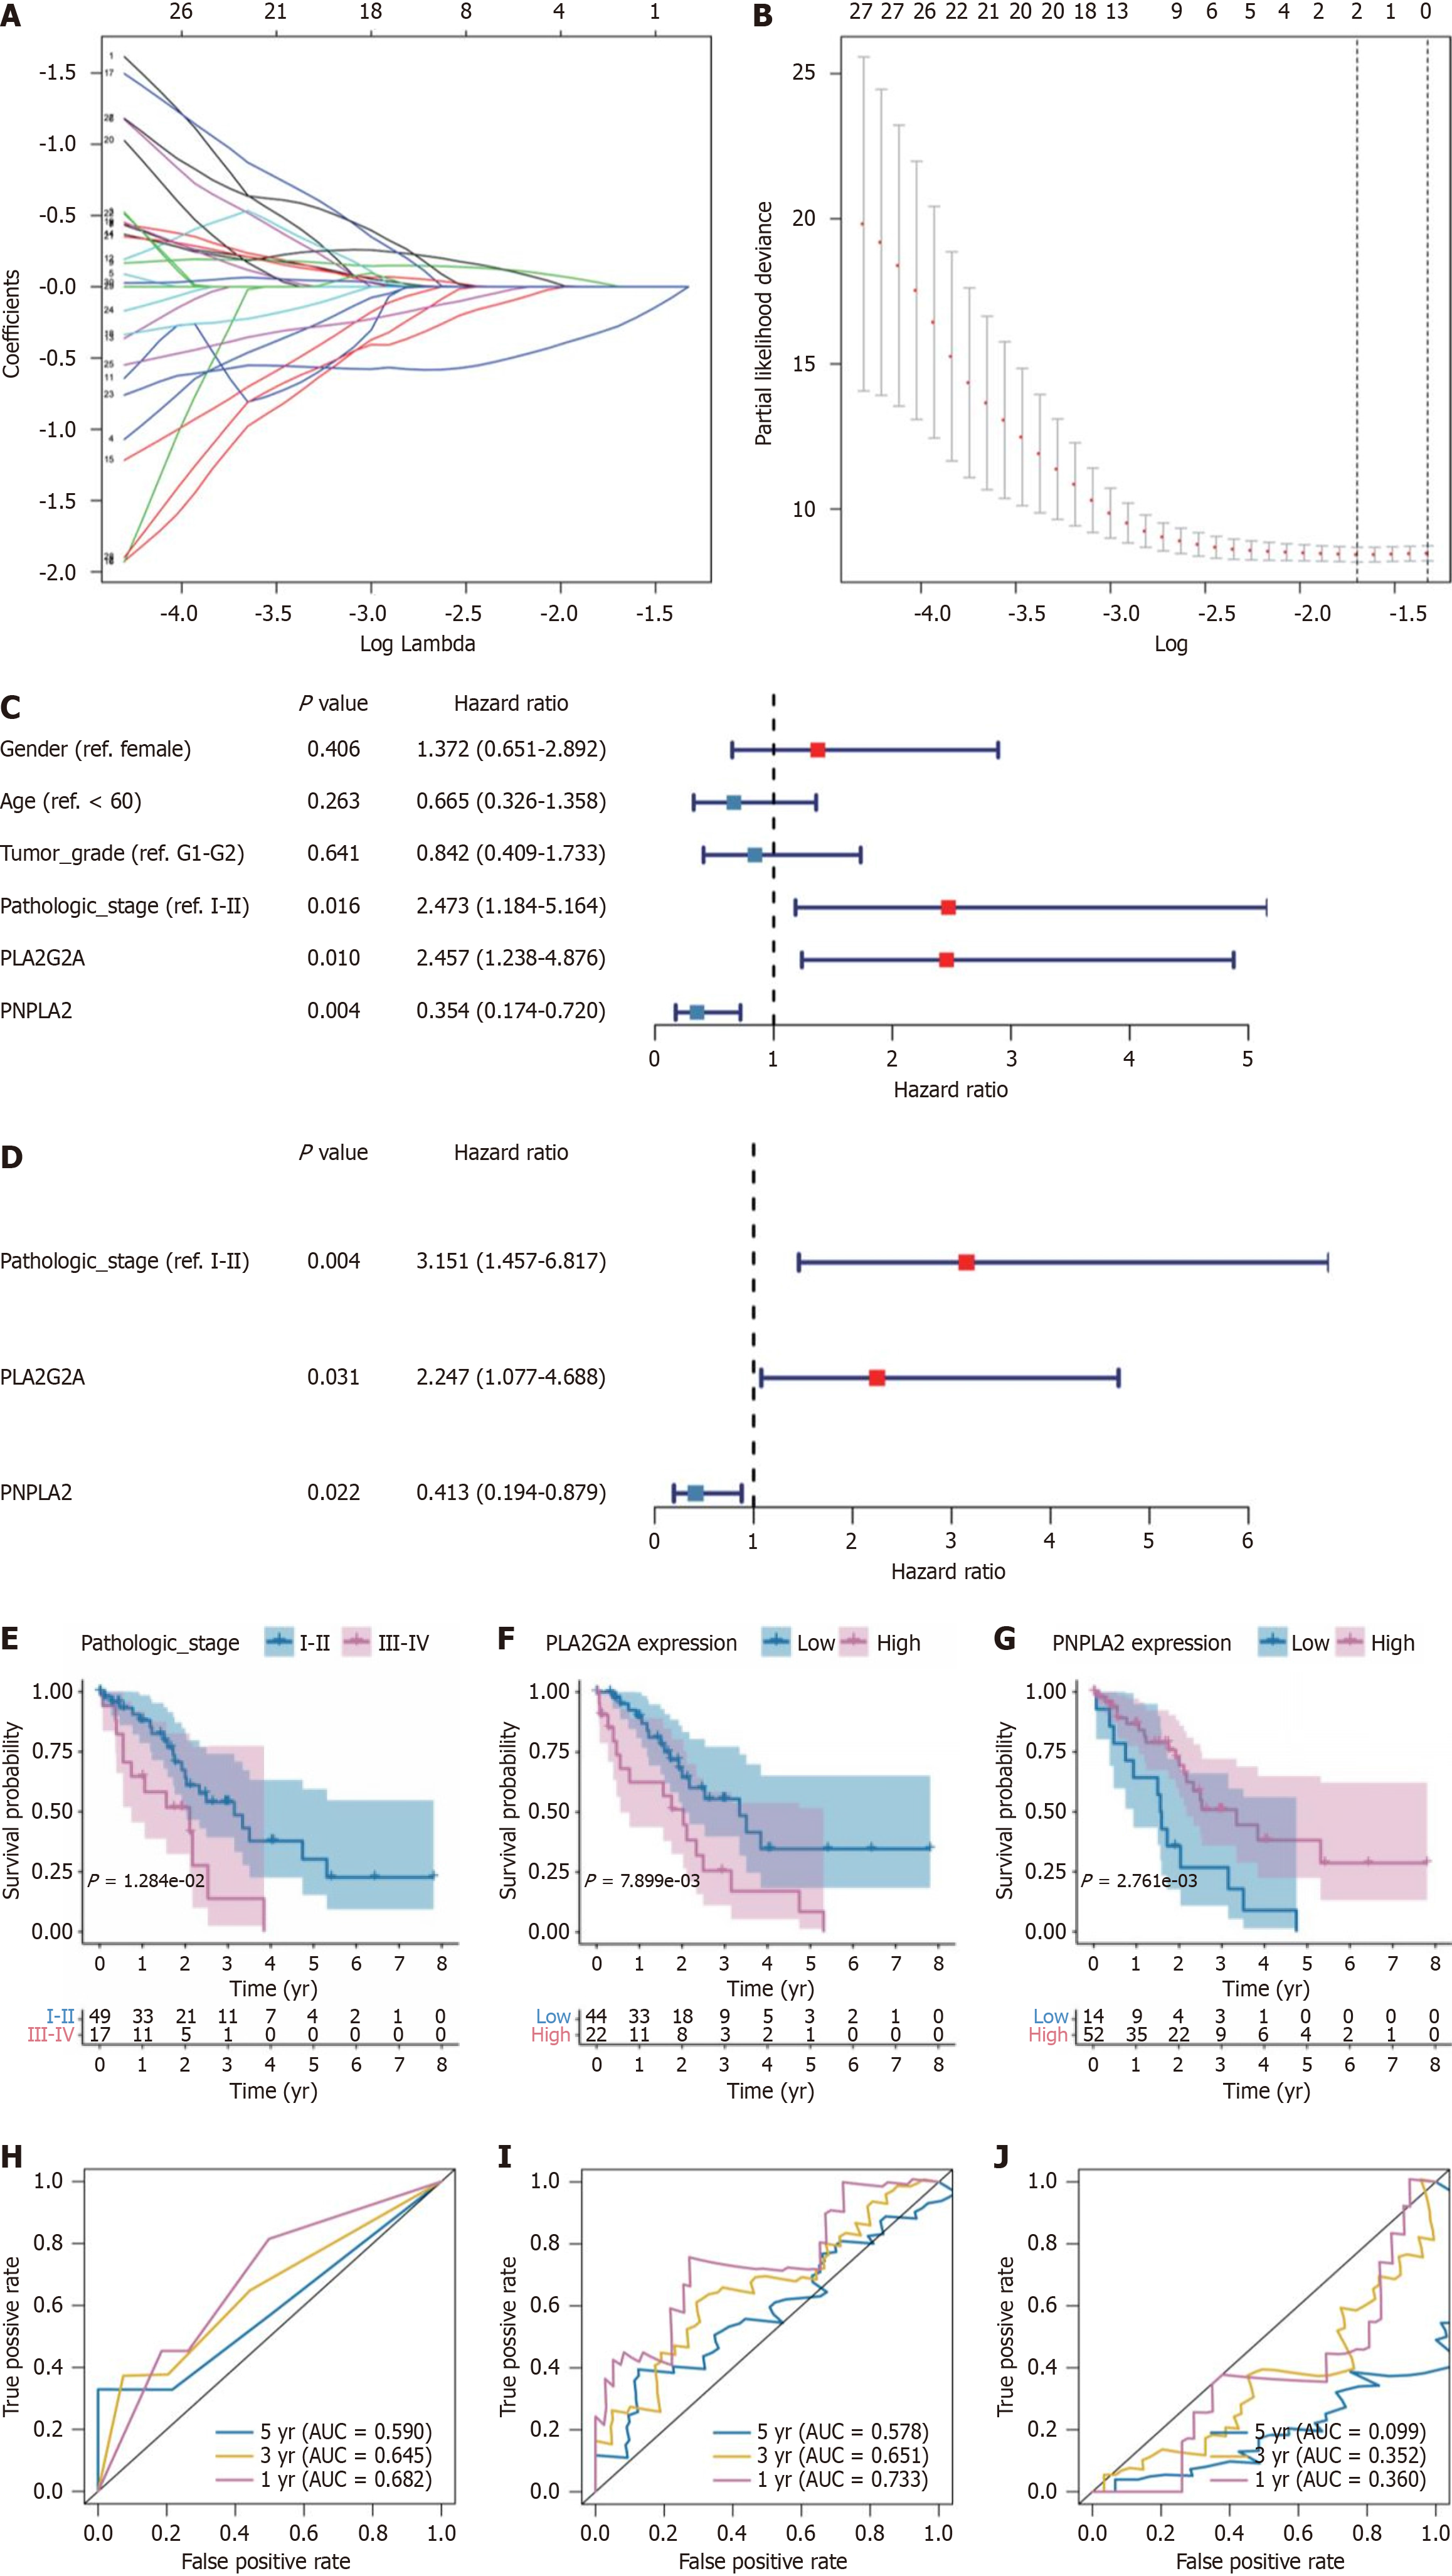
Figure 6 Least Absolute Shrinkage and Selection Operator model optimization and prognostic analysis of PLA2G2A and PNPLA2 in cholangiocarcinoma survival.
A: A coefficient profile plot was generated against the log (λ) sequence. Selection of the optimal parameter (λ) in the Least Absolute Shrinkage and Selection Operator (LASSO) model; B: Partial likelihood deviance for LASSO coefficient profiles. The red dots represent the partial likelihood values, the gray lines represent the standard error. Validation of independent prognostic factors; C: Univariate Cox regression analysis was performed to determine the independence of clinical characteristics as prognostic factors; D: Multivariable Cox regression analysis to identify clinical characteristics as prognostic factors; E-G: The survival curve for patients with, pathologic-stage, PLA2G2A, PNPLA2. The receiver operating characteristic (ROC) curve for 1, 3 and 5 overall survival of cholangiocarcinoma patients; H-J: 1-, 3-, and 5-years ROC curve corresponding to PLA2G2A, PNPLA2, and pathologic-stage. AUC: Area under the curve.
- Citation: Qiu C, Xiang YK, Da XB, Zhang HL, Kong XY, Hou NZ, Zhang C, Tian FZ, Yang YL. Phospholipase A2 enzymes PLA2G2A and PLA2G12B as potential diagnostic and prognostic biomarkers in cholangiocarcinoma. World J Gastrointest Surg 2024; 16(2): 289-306
- URL: https://www.wjgnet.com/1948-9366/full/v16/i2/289.htm
- DOI: https://dx.doi.org/10.4240/wjgs.v16.i2.289


