Copyright
©The Author(s) 2024.
World J Gastrointest Surg. Feb 27, 2024; 16(2): 289-306
Published online Feb 27, 2024. doi: 10.4240/wjgs.v16.i2.289
Published online Feb 27, 2024. doi: 10.4240/wjgs.v16.i2.289
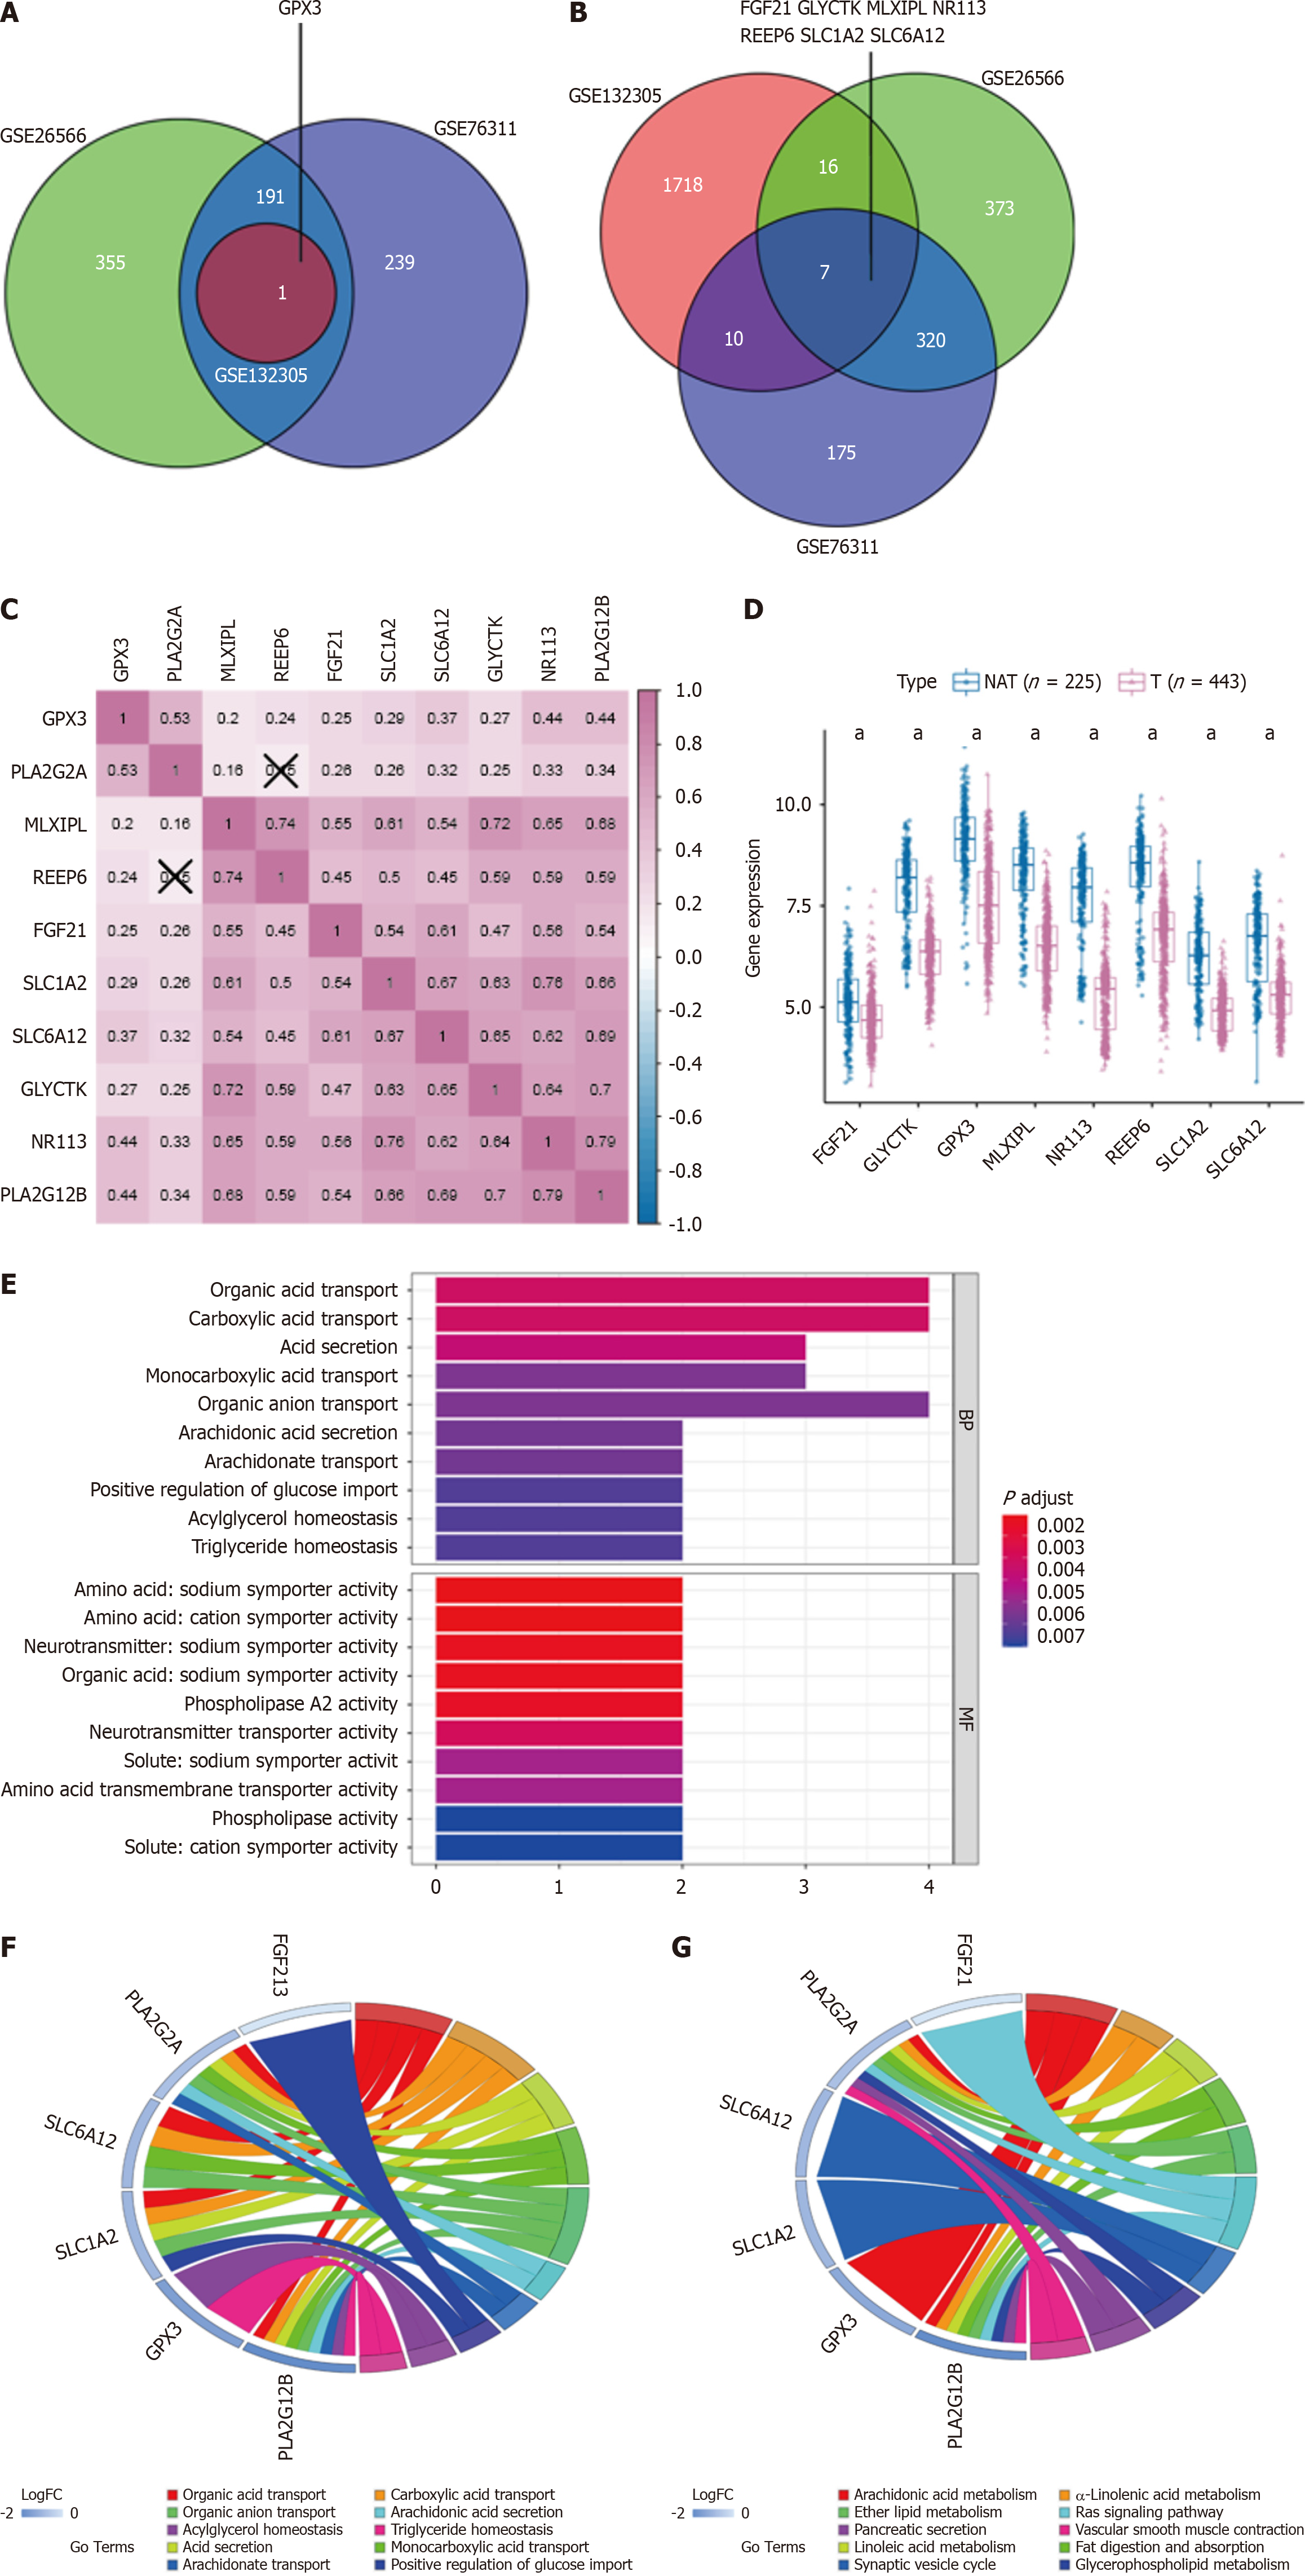
Figure 3 Hub genes linked to PLA2G2A and PLA2G12B in cholangiocarcinoma: expression, correlations, and pathway analysis.
A and B: Venn diagram showing the relevant hub genes associated with PLA2G2A, PLA2G12B expression, and differentially expressed in cholangiocarcinoma; C: Correlations between the expression of each relevant hub gene; D: The expression level of the relevant hub genes in cholangiocarcinoma (T) and normal tissues adjacent; E: Pathway enrichment and Genes Ontology (GO) function analysis of down-regulated genes correlated with biological BP and MF; F: Chord plot displaying the top 10 significant GO terms and their genes; G: Chord plot displaying the top 10 significant Kyoto Encyclopedia of Genes and Genomes terms and their genes. aP < 0.05. NAT: Adjacent normal tissues.
- Citation: Qiu C, Xiang YK, Da XB, Zhang HL, Kong XY, Hou NZ, Zhang C, Tian FZ, Yang YL. Phospholipase A2 enzymes PLA2G2A and PLA2G12B as potential diagnostic and prognostic biomarkers in cholangiocarcinoma. World J Gastrointest Surg 2024; 16(2): 289-306
- URL: https://www.wjgnet.com/1948-9366/full/v16/i2/289.htm
- DOI: https://dx.doi.org/10.4240/wjgs.v16.i2.289


