Copyright
©The Author(s) 2024.
World J Gastrointest Surg. Feb 27, 2024; 16(2): 289-306
Published online Feb 27, 2024. doi: 10.4240/wjgs.v16.i2.289
Published online Feb 27, 2024. doi: 10.4240/wjgs.v16.i2.289
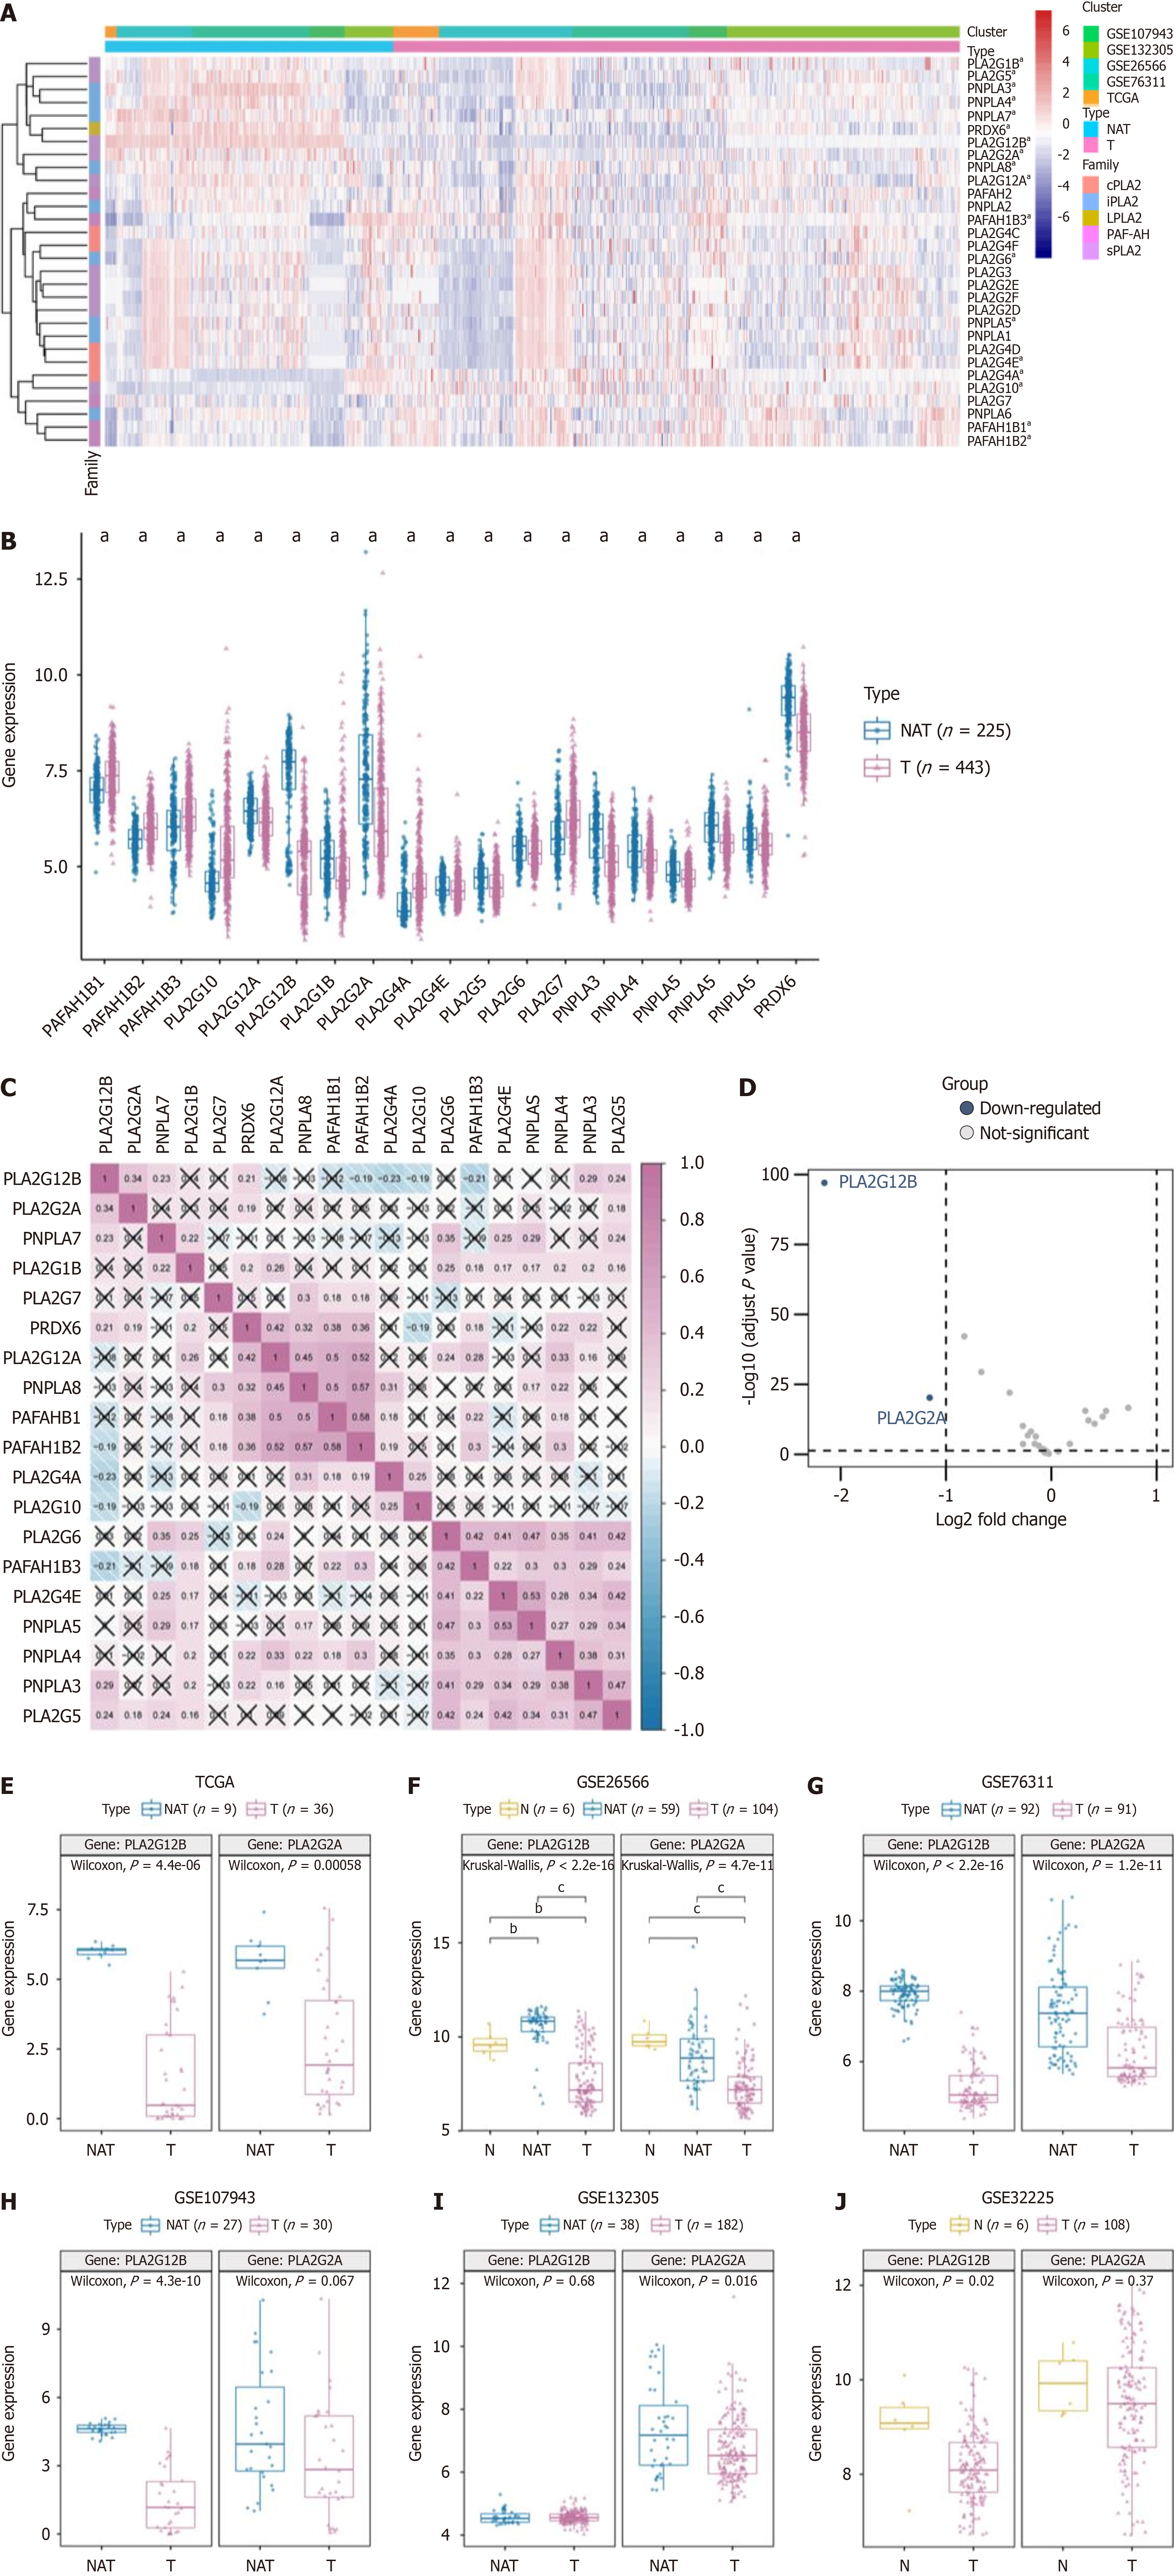
Figure 1 Analyzing phospholipase A2 gene family in cholangiocarcinoma: Expression patterns and correlations.
A: The enrichment levels of the 5 phospholipase A2 (PLA2) gene families include cytosolic PLA2, calcium-independent PLA2, lysosomal PLA2, platelet-activating factor acetylhydrolase, and secreted PLA2; B: The expression level of PLA2 gene family in cholangiocarcinoma (T) and normal tissues adjacent (NAT); C: Correlations between the expression of each PLA2 family member in cholangiocarcinoma; D: Differentially expressed genes between the PLA2 gene family in tumor and normal samples were shown in the volcano plot, with blue dots representing significantly down-regulated genes and red dots representing significantly up-regulated genes.; E-J: The expression levels of PLA2G2A and PLA2G12B in public databases (The Cancer Genome Atlas and the Gene Expression Omnibus) were found in the T and NAT groups. . aP < 0.05, bP < 0.01, cP < 0.001. NAT: Adjacent normal tissues
- Citation: Qiu C, Xiang YK, Da XB, Zhang HL, Kong XY, Hou NZ, Zhang C, Tian FZ, Yang YL. Phospholipase A2 enzymes PLA2G2A and PLA2G12B as potential diagnostic and prognostic biomarkers in cholangiocarcinoma. World J Gastrointest Surg 2024; 16(2): 289-306
- URL: https://www.wjgnet.com/1948-9366/full/v16/i2/289.htm
- DOI: https://dx.doi.org/10.4240/wjgs.v16.i2.289


