Copyright
©The Author(s) 2024.
World J Gastrointest Surg. Nov 27, 2024; 16(11): 3484-3498
Published online Nov 27, 2024. doi: 10.4240/wjgs.v16.i11.3484
Published online Nov 27, 2024. doi: 10.4240/wjgs.v16.i11.3484
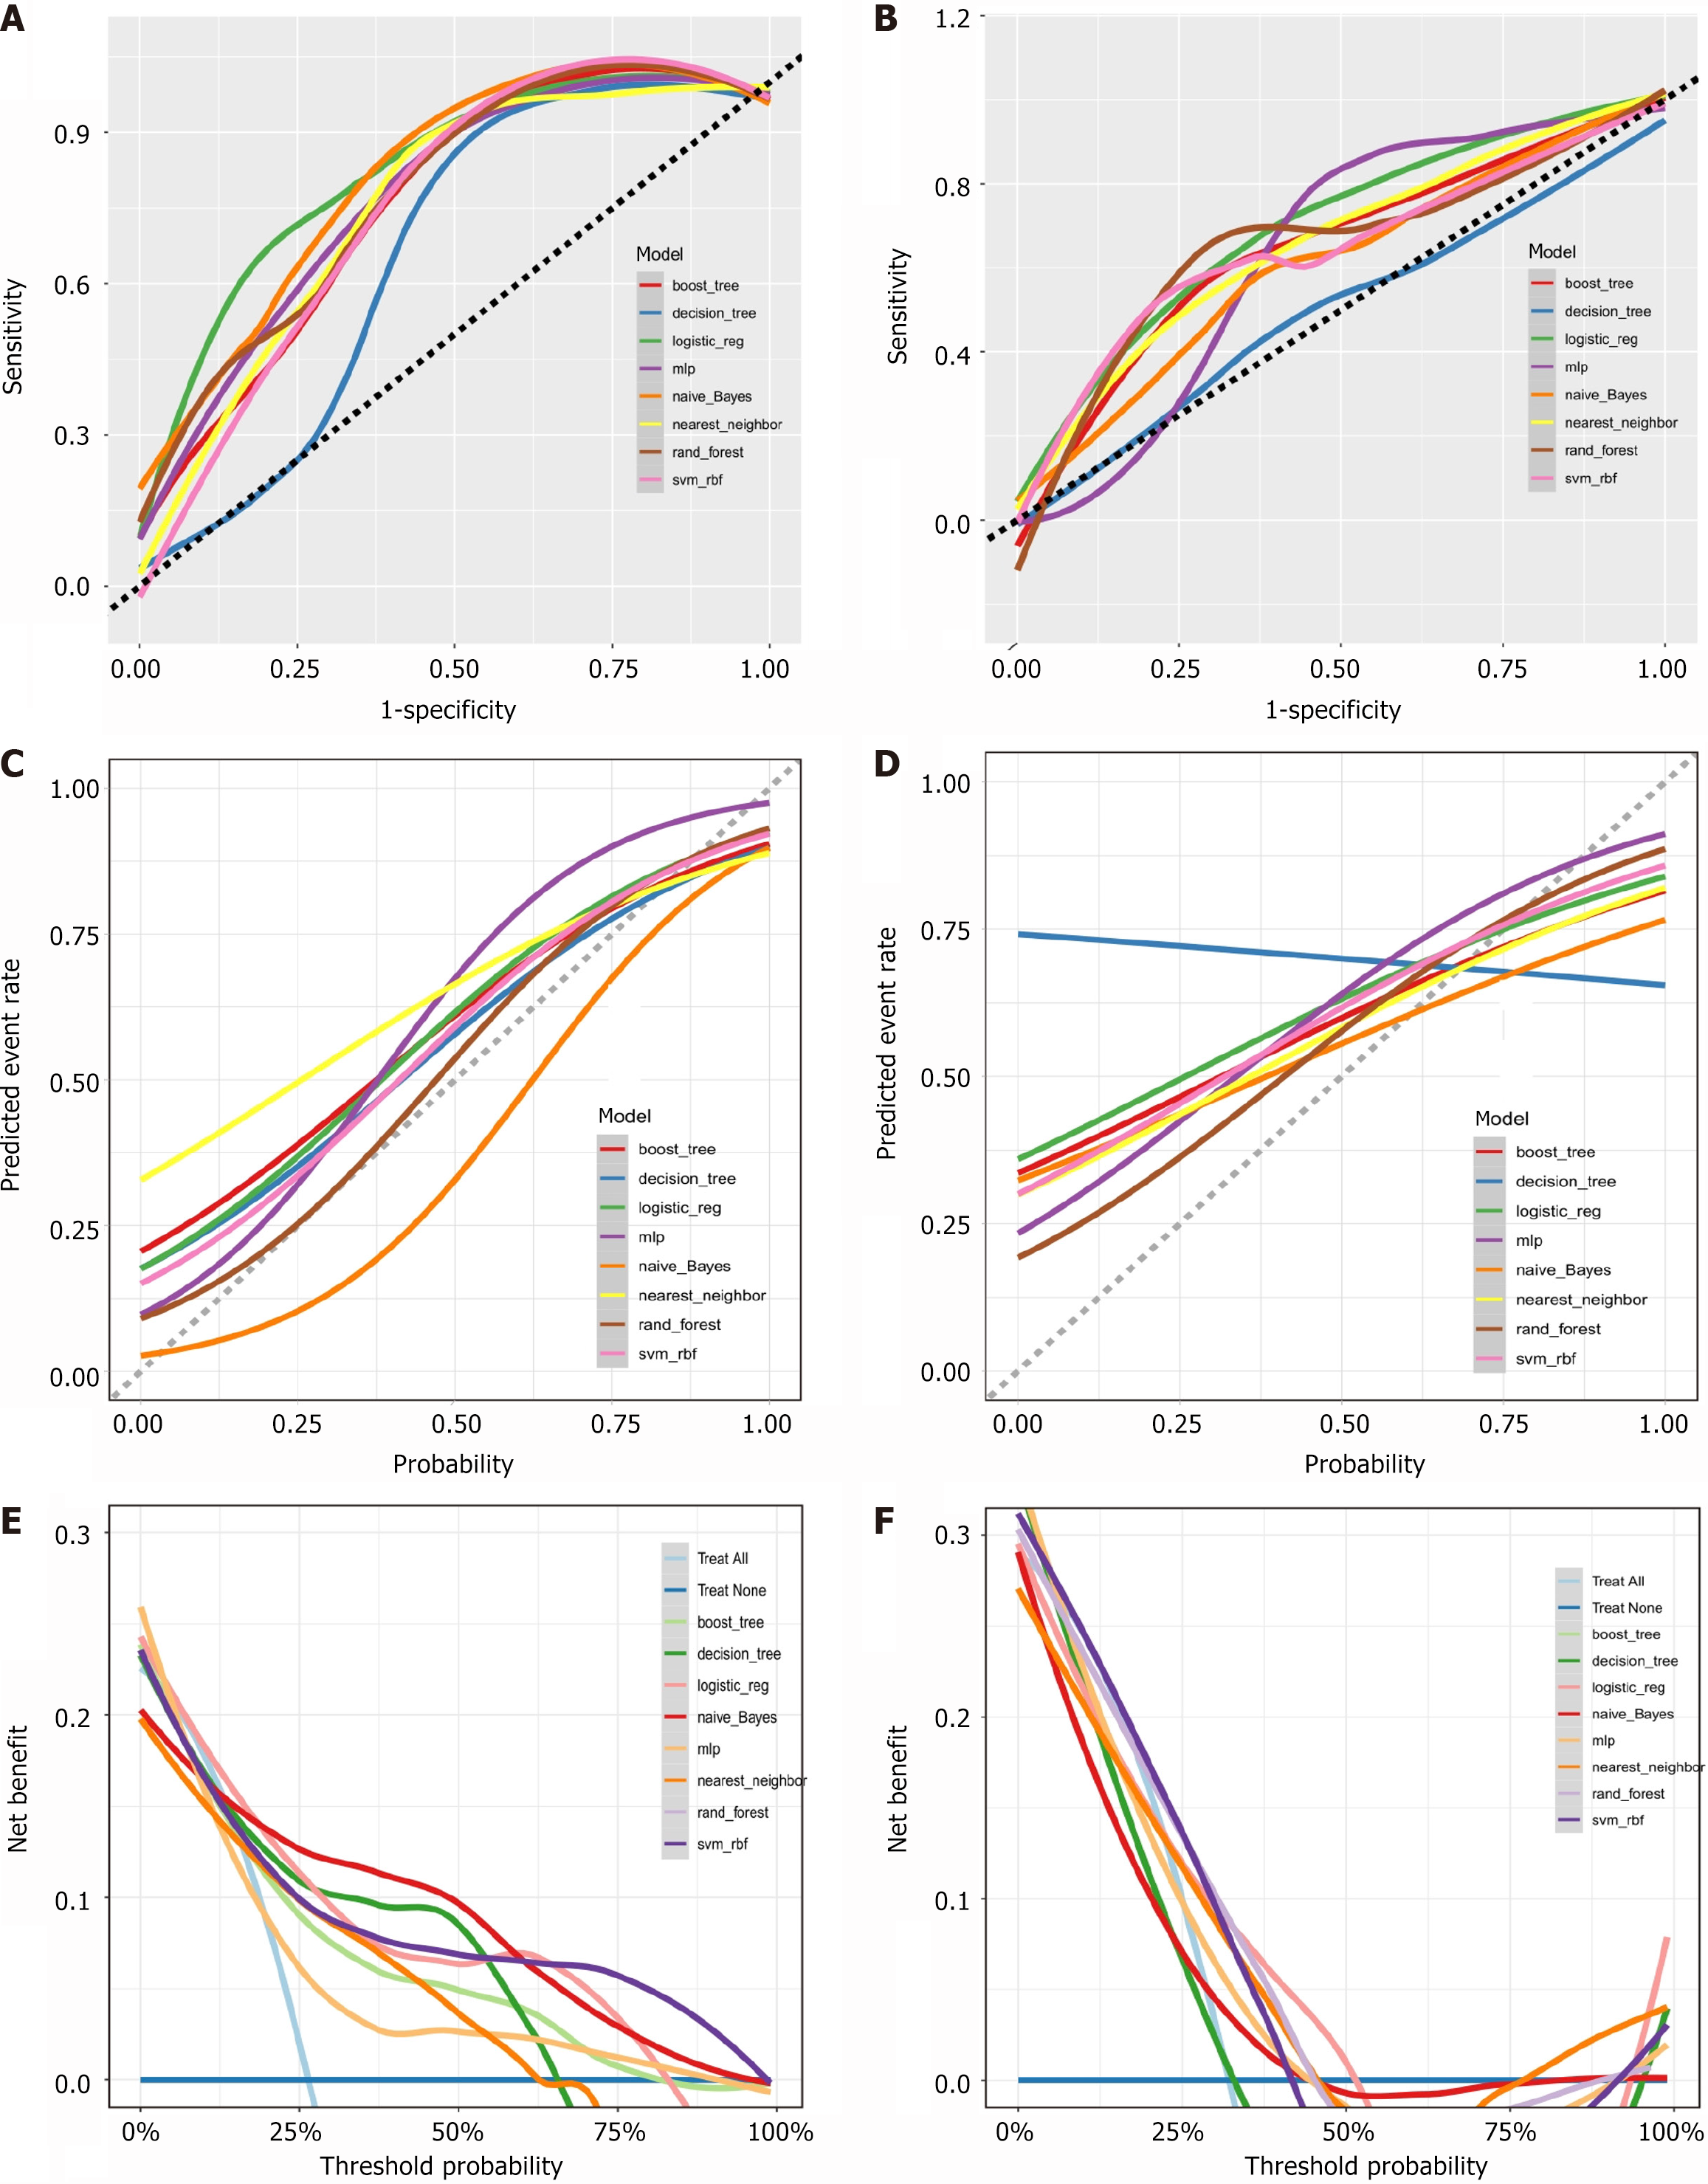
Figure 6 Comparison of area under the receiver operating characteristic curves between eight machine learning models in the training cohort.
A: Performance of eight models in the training cohort; B: Performance of eight models in the internal validation cohort. The Brier class represents the Brier score; C: Calibration curves of the eight models in the training; D: Calibration curves of the eight models in the internal validation cohorts; E: Comparison of decision curve analysis (DCA) curves between eight machine learning models in the training cohort; F: Comparison of DCA curves between eight machine learning models in the internal validation cohort.
- Citation: Shi S, Lu C, Shan L, Yan L, Liang Y, Feng T, Chen Z, Chen X, Wu X, Liu SD, Duan XL, Wang ZZ. Predicting prolonged postoperative ileus in gastric cancer patients based on bowel sounds using intelligent auscultation and machine learning. World J Gastrointest Surg 2024; 16(11): 3484-3498
- URL: https://www.wjgnet.com/1948-9366/full/v16/i11/3484.htm
- DOI: https://dx.doi.org/10.4240/wjgs.v16.i11.3484


